| Market Summary | Weekly Breakout Report | Top Breakout Choices | Top 2nd Chances | New Features | Tip of the Week |
The NASDAQ Composite is approaching resistance at 2535. If it breaks through that point it will be at its highest since May 2008.
We see that since the latest rally began in early September, the NASDAQ's relative strength compared to the S&P 500 has steadily improved. This trend has even accelerated in the last week as the S&P 500 has been hurt by falling financials in response to uncertainty over the extent of the impact of the foreclosure mess and continued economic uncertainty.
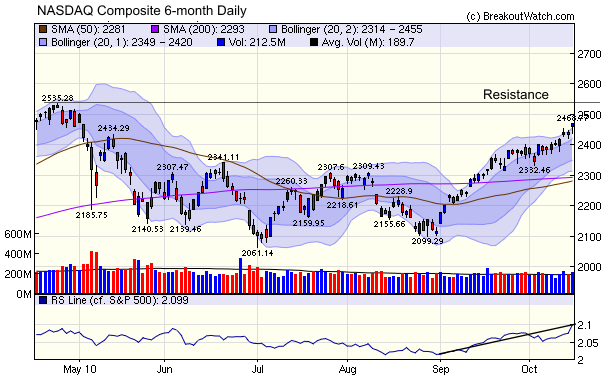
Note also that the 50 day moving average is about to cross the 200 day moving average which technicians will see as another positive indicator.
Some analysts believe that the stimulative effect is already priced into the markets and that the smart money will "sell the news" when the Fed makes its announcement in November. But you should read this article from David Kotok which makes a persuasive case for a bull market of several year's duration. Here are the highlights:
- "We expect an upward movement in stock prices through yearend because of the Fed’s actions."
- "He [Bernanke] wants inflation to reach a target of slightly under but around 2%. It is presently under 1%."
- "Safety in policymaking requires him to get sustainably above his target before he takes policy to neutral. That may take years to achieve."
- "Stocks are products of two inputs. They need lower
interest rates, which allows the equity risk premium to be higher.
Lower rates are here for a long while. In addition, stocks need the
corporate ability to finance at those low interest rates. Both
are in place and will be sustained for an “extended
period.” Stocks also need high productivity and low
labor-cost pressure. Both are in place. "
When should you Sell?
Our Sell assistant can help you make this difficult decision. It's included in our "Tradewatch" service which is free to Platinum subscribersThe Sell Assistant uses our Sell Model (see Sell Model Methodology) to determine if it thinks it is time to sell yet. By completing the form below and clicking the 'What's Your Opinion' button, we will produce a chart of the stock and if the Sell model thinks you should have sold it already, it will annotate the chart with the sell signal date and calculate a return based on the next day's opening price. Note that the Sell Assistant does not use a stop loss figure, but relies on its internal model to determine when to issue a sell signal. The Sell Assistant can be used for any stock, although it is only useful on stocks that were in a confirmed uptrend on the date of purchase.
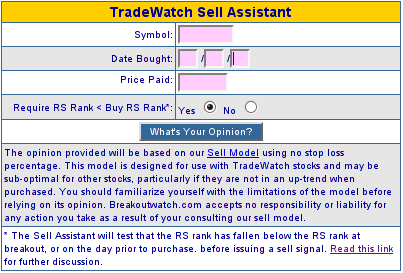
If the Sell Model does not find a sell signal, you can click the 'Create Sell Alert' button and create a sell alert. You now have several options:
- enter a stop loss figure either as a percentage or absolute value of your buy price
- enter a trailing stop percentage, which will trigger an alert if the closing price falls by that percentage from the highest intraday price after the buy date
- enter a target price which will trigger an alert when the stock closes above the target price
- specify if the Sell Assistant is to use RS rank as part of the sell decision process. In this case, the RS rank must be less than the RS rank at purchase for the sell signal to be issued. Specifying 'No' is the more conservative approach, but strong performers will be allowed to run if you answer yes. Read this link for further discussion.
- Override the Sell Assistant's default of sending an alert whenever any market signal goes to 'exit'
| Index | Value | Change Week | Change YTD | Trend | ||||||||||||||||||||||||||||||||||||
|---|---|---|---|---|---|---|---|---|---|---|---|---|---|---|---|---|---|---|---|---|---|---|---|---|---|---|---|---|---|---|---|---|---|---|---|---|---|---|---|---|
| Dow | 11062.8 | 0.51% | 6.09% | Up | ||||||||||||||||||||||||||||||||||||
| NASDAQ | 2468.77 | 2.78% | 8.8% | Up | ||||||||||||||||||||||||||||||||||||
| S&P 500 | 1176.19 | 0.95% | 5.48% | Up | ||||||||||||||||||||||||||||||||||||
| Russell 2000 | 703.16 | 1.35% | 10.9% | Up | ||||||||||||||||||||||||||||||||||||
| Wilshire 5000 | 12326.8 | 1.07% | 7.21% | Up | ||||||||||||||||||||||||||||||||||||
1The Market Signal is derived
from our proprietary market model. The market model is described on the
site.
2The site also shows industry rankings based on fundamentals, combined technical and fundamentals, and on price alone. The site also shows daily industry movements. |
||||||||||||||||||||||||||||||||||||||||
|
# of Breakouts
|
Period Average1
|
Max. Gain During Period2
|
Gain at Period Close3
|
|
|---|---|---|---|---|
| This Week | 19 | 25.92 | 7.08% | 3.83% |
| Last Week | 50 | 24.08 | 8.94% | 5.26% |
| 13 Weeks | 340 | 26.54 | 16.08% |
10.55% |
2This represents the return if each stock were bought at its breakout price and sold at its intraday high.
3This represents the return if each stock were bought at its breakout price and sold at the most recent close.
|
Category
|
Symbol
|
Company Name
|
Expected Gain1
|
|---|---|---|---|
| Best Overall | HSWI | HSW International, Inc. | 109 |
| Top Technical | GLPW | 56 | |
| Top Fundamental | PH | Parker Hannifin Corporation | 33 |
| Top Tech. & Fund. | LPSN | LivePerson Inc. | 91 |
|
Category
|
Symbol
|
Company Name
|
Expected Gain1
|
|---|---|---|---|
| Best Overall | MGPI | MGP Ingredients Inc. | 80 |
| Top Technical | MGPI | MGP Ingredients Inc. | 80 |
| Top Fundamental | JLL | Jones Lang Lasalle Inc. | 43 |
| Top Tech. & Fund. | JLL | Jones Lang Lasalle Inc. | 43 |
If you received this newsletter from a friend and you would like to receive it regularly please go to the BreakoutWatch.com site and enter as a Guest. You will then be able to register to receive the newsletter.
Copyright © 2010 NBIcharts, LLC dba BreakoutWatch.com.
All rights reserved.
" BreakoutWatch," the BreakoutWatch.com "eye" logo, and the slogan
"tomorrow's breakouts today" are service marks of NBIcharts LLC. All
other marks are the property of their respective owners, and are used
for descriptive purposes only.
BreakoutWatch is not affiliated with Investor's Business Daily
or with Mr. William O'Neil.
Our site, research and analysis is supported entirely by subscription
and is free from advertising.