| Market Summary | Weekly Breakout Report | Top Breakout Choices | Top 2nd Chances | New Features | Tip of the Week |
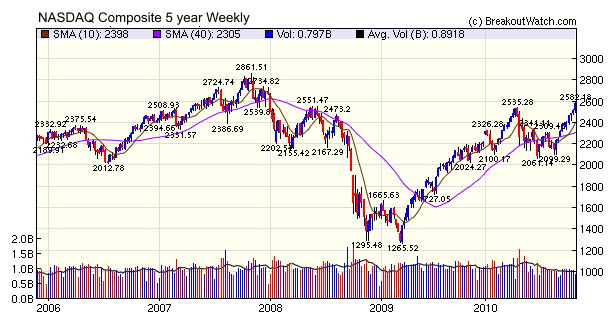
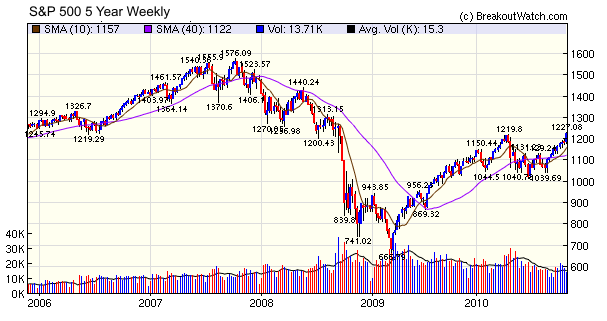
The NASDAQ Composite closed the week at its highest level since January 4, 2008, and has gained 104% since its March, 2009 low. The index is now just 303 points below its November 2, 2007 high. A further gain of 12% from here will see the index reach that significant point of resistance due to lots of overhead supply. Compare this performance with that of the S&P 500, which has risen 82% from its March, 2008 low, but still has to gain a further 28% to recover to its 2007 high.
Does this mean that the S&P 500 has more upside potential? Possibly, as the QE2 stimulus will flow to the major banks first. With money being cheap due to low interest rates the reward to risk ratio for equities looks more attractive so we will see much of the QE2 money flow from the banks into the equities markets. They have to put the money somewhere (or inflation will erode its value) and they are unwilling to lend to businesses and individuals while the economy is still sputtering. Note that the S&P 500 gained 3.6% this week compared to the NASDAQ's 2.85%.
The number of successful breakouts jumped to 53 this week with an average gain at Friday's close of 5.2% easily beating the returns of the major indexes.
No new features this
week
A potential subscriber asked us
"Lets say I can set up breakout alerts of my own on my broker's software (price and volume),but I'd like the watchlist on your site to give me a very small amount of candidates, preferably which already meet cantata conditions and telling me in advance how much volume will be needed for a 1.5 vol breakout. Which one of your subscriptions will cover it?"Since few of us are as wealthy as we were, this topic may be of interest to our newsletter readers so here's the answer.
The minimum subscription that gives access to our watchlists each day is the Silver subscription. At this level you can see all watchlists, all symbols and all the technical and fundamental analysis associated with each symbol, including breakout price and breakout volume at the 1.5 times average daily volume level.
At the Silver level you don't get access to
- email alerts
- filters
- personal watchlists
- watchlist downloads
- chart browser
- database search
A Silver subscription costs $38.50 a month with hefty discounts for longer periods.
For the even more budget conscious, there is also our "essential" service which still gives you access to the watchlists and CE (only for watchlist stocks) for just $19.95 a month. the url for the essential service is http://essential.breakoutwatch.com.
| Index | Value | Change Week | Change YTD | Trend | ||||||||||||||||||||||||||||||||||||
|---|---|---|---|---|---|---|---|---|---|---|---|---|---|---|---|---|---|---|---|---|---|---|---|---|---|---|---|---|---|---|---|---|---|---|---|---|---|---|---|---|
| Dow | 11444.1 | 2.93% | 9.74% | Up | ||||||||||||||||||||||||||||||||||||
| NASDAQ | 2578.98 | 2.85% | 13.65% | Up | ||||||||||||||||||||||||||||||||||||
| S&P 500 | 1225.85 | 3.6% | 9.93% | Up | ||||||||||||||||||||||||||||||||||||
| Russell 2000 | 736.59 | 4.73% | 16.17% | Up | ||||||||||||||||||||||||||||||||||||
| Wilshire 5000 | 12870.4 | 3.69% | 11.94% | Up | ||||||||||||||||||||||||||||||||||||
1The Market Signal is derived
from our proprietary market model. The market model is described on the
site.
2The site also shows industry rankings based on fundamentals, combined technical and fundamentals, and on price alone. The site also shows daily industry movements. |
||||||||||||||||||||||||||||||||||||||||
|
# of Breakouts
|
Period Average1
|
Max. Gain During Period2
|
Gain at Period Close3
|
|
|---|---|---|---|---|
| This Week | 53 | 28.69 | 8.12% | 5.24% |
| Last Week | 33 | 27.38 | 10.64% | 6.33% |
| 13 Weeks | 390 | 31 | 16.8% |
11.67% |
2This represents the return if each stock were bought at its breakout price and sold at its intraday high.
3This represents the return if each stock were bought at its breakout price and sold at the most recent close.
|
Category
|
Symbol
|
Company Name
|
Expected Gain1
|
|---|---|---|---|
| Best Overall | REXI | Resource America, Inc. | 118 |
| Top Technical | PSUN | Pacific Sunwear of California, Inc. | 117 |
| Top Fundamental | PWER | Power-One, Inc. | 108 |
| Top Tech. & Fund. | PWER | Power-One, Inc. | 108 |
|
Category
|
Symbol
|
Company Name
|
Expected Gain1
|
|---|---|---|---|
| Best Overall | GSIT | GSI Technology, Inc. | 115 |
| Top Technical | ACAT | Arctic Cat Inc. | 77 |
| Top Fundamental | GSIT | GSI Technology, Inc. | 115 |
| Top Tech. & Fund. | GSIT | GSI Technology, Inc. | 115 |
If you received this newsletter from a friend and you would like to receive it regularly please go to the BreakoutWatch.com site and enter as a Guest. You will then be able to register to receive the newsletter.
Copyright © 2010 NBIcharts, LLC dba BreakoutWatch.com.
All rights reserved.
" BreakoutWatch," the BreakoutWatch.com "eye" logo, and the slogan
"tomorrow's breakouts today" are service marks of NBIcharts LLC. All
other marks are the property of their respective owners, and are used
for descriptive purposes only.
BreakoutWatch is not affiliated with Investor's Business Daily
or with Mr. William O'Neil.
Our site, research and analysis is supported entirely by subscription
and is free from advertising.