| Market Summary | Weekly Breakout Report | Top Breakout Choices | Top 2nd Chances | New Features | Tip of the Week |
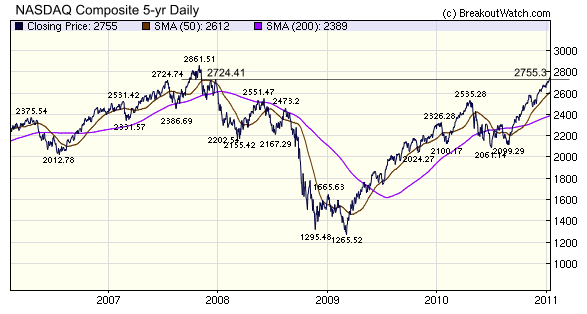
The NASDAQ Composite closed on Friday at 2755.3 putting it above the penultimate resistance point of 2724.4 (December 26, 2007) before reaching its 2007 high of 2861.5. That's just 3.9% higher than where we are now so we should see a test of a new 10 year high soon, possibly in the coming week. Will the NASDAQ Composite pass the test?
Earnings will be the key. If we see more sizzling performers like J. P. Morgan and Intel (likely, certainly in the financials) and semiconductors keep moving up (the SOX is 5% higher since last Friday) then I expect we will break 2861 in the next two weeks. What happens after that is anyone's guess. The markets are looking over extended after the steep run up since September, so I expect a period of consolidation after we set new highs.
Of the 17 confirmed breakouts for the week, only three were below their breakout price by Friday's close. The rest gained an average of 3.9%. The best performers broke out from a cup-with-handle base and were Callon Petroleum (CPE), + 18.9%, and Gentium (GENT),+ 12.5%. ValueVision Media (VVTV) broke out from a High Tight Flag and gained 7.6% by Friday's close.
We regret that our real-time feed was down on Friday so no alerts were issued. This is particularly unfortunate as this was such a strong day for the markets. We have extended the subscription period of all Trial, Gold and Platinum subscribers by two days in compensation.
Adjustment to the Meets Target Criteria Designation
As we promised last week, we have modified our Meets Target Criteria (MTC) designation so it is assigned only to stocks that are in industry groups that are in the top 70% of the industry rankings. In practice, this means that stocks that rank 1 - 149 in or technical ranking of industries can be given an MTC rating.
As we promised last week, we have modified our Meets Target Criteria (MTC) designation so it is assigned only to stocks that are in industry groups that are in the top 70% of the industry rankings. In practice, this means that stocks that rank 1 - 149 in or technical ranking of industries can be given an MTC rating.
Understanding MTC Limitations
While, our MTC designation is useful in selecting stocks that are more likely to perform well after breakout, the designation should be used with an understanding of what it means, and why some potentially high performing stocks cannot receive the rating. For the reasons we'll now discuss, if you select only MTC stocks you could be missing some potentially high performing stocks.
To receive our MTC designation, a stock must meet these criteria:
An ETF can never qualify for an MTC designation because we don't have fundamental data for them. Nevertheles, ETF's can be excellent performers. For example, ProShares UltraPro MidCap400 (UMDD) with an RS Rank of 92 broke out on December 1, and has since gained 24.6%.
While, our MTC designation is useful in selecting stocks that are more likely to perform well after breakout, the designation should be used with an understanding of what it means, and why some potentially high performing stocks cannot receive the rating. For the reasons we'll now discuss, if you select only MTC stocks you could be missing some potentially high performing stocks.
To receive our MTC designation, a stock must meet these criteria:
- must be on our cup-with-handle watchlist
- Average daily volume >= 100,000
- Breakout price >= $6
- Relative Strength (RS) Rank >= 92
- CANTATA Fundamental Criterion #2 (CEF2) >= 0.6
- CANTATA Fundamental Criterion #3 (CEF3) >= 0.6
- Must be in an industry group that ranks 1-149 in our industry technical rankings (new)
An ETF can never qualify for an MTC designation because we don't have fundamental data for them. Nevertheles, ETF's can be excellent performers. For example, ProShares UltraPro MidCap400 (UMDD) with an RS Rank of 92 broke out on December 1, and has since gained 24.6%.
| Index | Value | Change Week | Change YTD | Trend | ||||||||||||||||||||||||||||||||||||
|---|---|---|---|---|---|---|---|---|---|---|---|---|---|---|---|---|---|---|---|---|---|---|---|---|---|---|---|---|---|---|---|---|---|---|---|---|---|---|---|---|
| Dow | 11787.4 | 0.96% | 1.81% | Up | ||||||||||||||||||||||||||||||||||||
| NASDAQ | 2755.3 | 1.93% | 3.86% | Up | ||||||||||||||||||||||||||||||||||||
| S&P 500 | 1293.24 | 1.71% | 2.83% | Up | ||||||||||||||||||||||||||||||||||||
| Russell 2000 | 807.57 | 2.51% | 3.05% | Up | ||||||||||||||||||||||||||||||||||||
| Wilshire 5000 | 13672.7 | 1.82% | 2.88% | Up | ||||||||||||||||||||||||||||||||||||
1The Market Signal is derived from our proprietary
market model. The market model is described on the site. 2The site also shows industry rankings based on fundamentals, combined technical and fundamentals, and on price alone. The site also shows daily industry movements. |
||||||||||||||||||||||||||||||||||||||||
# of Breakouts |
Period Average1 |
Max. Gain During Period2 |
Gain at Period Close3 |
|
|---|---|---|---|---|
| This Week | 17 | 19.15 | 7.45% | 3.91% |
| Last Week | 27 | 20 | 8.7% | 4.31% |
| 13 Weeks | 298 | 21.62 | 16.77% |
9.66% |
2This represents the return if each stock were bought at its breakout price and sold at its intraday high.
3This represents the return if each stock were bought at its breakout price and sold at the most recent close.
Category |
Symbol |
Company Name |
Expected Gain1 |
|---|---|---|---|
| Best Overall | LSCC | Lattice Semiconductor | 111 |
| Top Technical | PATH | NuPathe Inc | 82 |
| Top Fundamental | MELI | MercadoLibre, Inc. | 41 |
| Top Tech. & Fund. | PCLN | priceline.com Incorporated | 34 |
Category |
Symbol |
Company Name |
Expected Gain1 |
|---|---|---|---|
| Best Overall | LNG | Cheniere Energy, Inc. | 108 |
| Top Technical | LNG | Cheniere Energy, Inc. | 108 |
| Top Fundamental | MTL | Mechel OAO (ADR) | 54 |
| Top Tech. & Fund. | MTL | Mechel OAO (ADR) | 54 |
If you received this newsletter from a friend and you would like to receive it regularly please go to the BreakoutWatch.com site and enter as a Guest. You will then be able to register to receive the newsletter.
Copyright © 2011 NBIcharts, LLC dba BreakoutWatch.com.
All rights reserved.
"
BreakoutWatch," the BreakoutWatch.com "eye" logo, and the
slogan "tomorrow's breakouts today" are service marks of NBIcharts
LLC. All other marks are the property of their respective owners, and are
used for descriptive purposes only.
BreakoutWatch is not affiliated with Investor's Business Daily or with Mr. William O'Neil.
Our site, research and analysis is supported entirely by subscription and is free from advertising.