| Market Summary | Weekly Breakout Report | Top Breakout Choices | Top 2nd Chances | New Features | Tip of the Week |
As usual, we consider the state of the NASDAQ Composite index as the majority of successful breakouts come from the NASDAQ exchange.
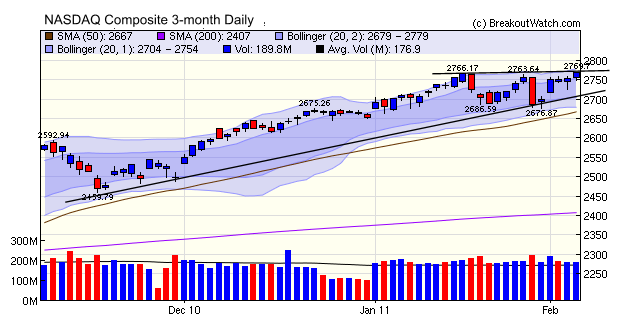
The index made a healthy gain of 3.1% for the week and closed on Friday two points above its recent high and at its best level since November 7, 2007. While the chart shows that it has struggled to reach this new high over the last two weeks, volume for the week was above average which indicates that the index still has positive momentum. Had volume been lower than average, then this would have been a sign that the rally was stalling. As it is, the chart shows the index is in an ascending triangle pattern, which usually resolves with another breakout to the upside. While this will be good in the longer term, what we need now is a correction of 6-8 weeks in the short term for reasons we'll explain below.

As the recovery has progressed and markets are approaching their 2007 highs, it is interesting to note that the number of breakout possibilities has fallen. Since the start of the year, the average number of stocks on our cup-with-handle watchlist each day has been 58. At the same time a year ago, the average number was 105. This has happened, of course, because so many stocks have broken through former resistance levels and so fewer breakout patterns are forming. A short correction followed by a new rally would allow more patterns to form from which more, and healthier, breakouts could occur.
New Features this Week
The ability to view the daily report archive was compromised by the "click here" advertisement and this has been corrected.
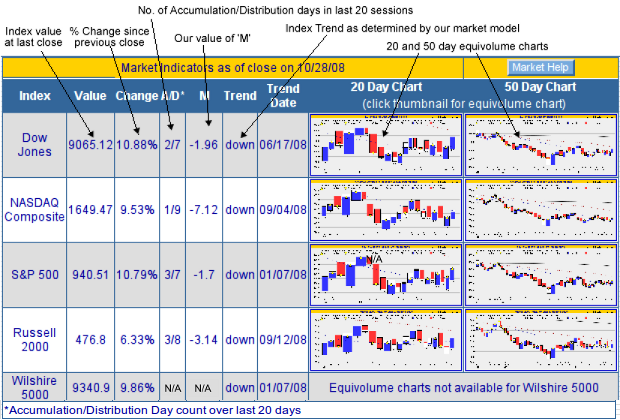
The daily email includes information taken from our market analysis page. That information is explained in the "Market Help" but a link to that page is not (yet) included in the email, so some subscribers are having difficulty understanding what the various data elements mean. For their benefit, we are reproducing part of the market help page here.
As a reminder, the best source for help with the information we provide is on our Support > Learning Center > Help Reference page.
|
The Market Analysis and Daily Email
provide a unique summary of market, industry and breakout performance
for the day. In addition to showing the daily change in five major
indexes, we provide some features unavailable elsewhere:
Industries to Watch As part of the Market Analysis display and the daily email, we also include a summary of the best performing industries and the industries that are moving to prominence. Our industry rankings are derived from our proprietary ranking methodology which uses our technical ranking methodology. We do not use any third party (such as Morningstar). The industries that are moving up the rankings may be where the biggest price gains are to found. Other Daily Email Information
|
| Index | Value | Change Week | Change YTD | Trend | ||||||||||||||||||||||||||||||||||||
|---|---|---|---|---|---|---|---|---|---|---|---|---|---|---|---|---|---|---|---|---|---|---|---|---|---|---|---|---|---|---|---|---|---|---|---|---|---|---|---|---|
| Dow | 12092.2 | 2.27% | 4.45% | Up | ||||||||||||||||||||||||||||||||||||
| NASDAQ | 2769.3 | 3.07% | 4.39% | Up | ||||||||||||||||||||||||||||||||||||
| S&P 500 | 1310.87 | 2.71% | 4.23% | Up | ||||||||||||||||||||||||||||||||||||
| Russell 2000 | 800.11 | 3.19% | 2.1% | Up | ||||||||||||||||||||||||||||||||||||
| Wilshire 5000 | 13818.3 | 2.73% | 3.98% | Up | ||||||||||||||||||||||||||||||||||||
1The Market Signal is derived
from our proprietary market model. The market model is described on the
site.
2The site also shows industry rankings based on fundamentals, combined technical and fundamentals, and on price alone. The site also shows daily industry movements. |
||||||||||||||||||||||||||||||||||||||||
|
# of Breakouts
|
Period Average1
|
Max. Gain During Period2
|
Gain at Period Close3
|
|
|---|---|---|---|---|
| This Week | 14 | 13.85 | 6.63% | 4.72% |
| Last Week | 21 | 16.69 | 3.32% | -1.06% |
| 13 Weeks | 228 | 17.46 | 11.81% |
2.85% |
2This represents the return if each stock were bought at its breakout price and sold at its intraday high.
3This represents the return if each stock were bought at its breakout price and sold at the most recent close.
|
Category
|
Symbol
|
Company Name
|
Expected Gain1
|
|---|---|---|---|
| Best Overall | MRT | Morton's Restaurant Group, Inc. | 110 |
| Top Technical | KRO | Kronos Worldwide, Inc. | 45 |
| Top Fundamental | BIDU | Baidu.com, Inc. (ADR) | 45 |
| Top Tech. & Fund. | TNAV | TeleNav, Inc. | 0 |
|
Category
|
Symbol
|
Company Name
|
Expected Gain1
|
|---|---|---|---|
| Best Overall | HEES | H&E Equipment Services, Inc. | 73 |
| Top Technical | KRO | Kronos Worldwide, Inc. | 50 |
| Top Fundamental | UA | Under Armour, Inc. | 45 |
| Top Tech. & Fund. | UA | Under Armour, Inc. | 45 |
If you received this newsletter from a friend and you would like to receive it regularly please go to the BreakoutWatch.com site and enter as a Guest. You will then be able to register to receive the newsletter.
Copyright © 2011 NBIcharts, LLC dba BreakoutWatch.com.
All rights reserved.
" BreakoutWatch," the BreakoutWatch.com "eye" logo, and the slogan
"tomorrow's breakouts today" are service marks of NBIcharts LLC. All
other marks are the property of their respective owners, and are used
for descriptive purposes only.
BreakoutWatch is not affiliated with Investor's Business Daily
or with Mr. William O'Neil.
Our site, research and analysis is supported entirely by subscription
and is free from advertising.
