| Market Summary | Weekly Breakout Report | Top Breakout Choices | Top 2nd Chances | New Features | Tip of the Week |

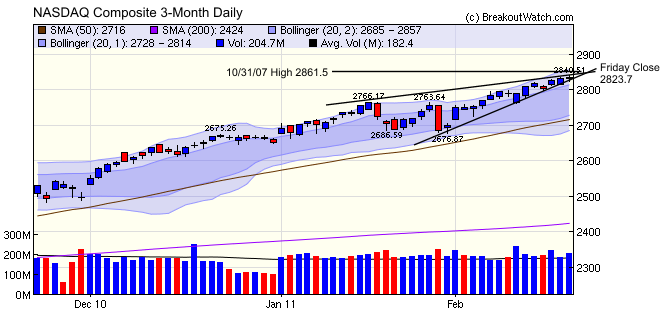
The NASDAQ Composite continued its ascending triangle pattern and is closing in on its 2007 high set on October 31, 2007. In fact, the index needs just another 37.8 points (1.3%) before it reaches that level.
Coincidentally, the 2861 resistance level coincides with the ascending triangle upper bound so we can expect 2861.5 to be a major resistance level. It may take two or more attempts to break through that level but a breakout on strong volume would be a strong bullish signal.
Equally, failure to breach the 2861 level and a pullback on higher volume would signal the start of a correction.
The third possibility, and the most likely in my view, is that the NASDAQ (and other indexes too) will enter a trading range which will ultimately resolve to the upside.
These points on a chart where the slope changes direction are called "Inflection points". I'm betting that we are approaching a special case of an inflection point, called a saddle point.
The markets are closed on Monday for the President's Day holiday. Enjoy your long weekend!
There are no new features this week.
One of our favorite blogs is Barry Ritholz's "The Big Picture".
Earlier this week he published a list of recommended rule sets to read. You may enjoy them over the weekend.
• Livermores Seven Trading Lessons
• Bob Farrell’s 10 Rules for Investing
• John Murphy’s Ten Laws of Technical Trading
• Art Huprich’s Market Truisms and Axioms
• DENNIS GARTMAN’S NOT-SO-SIMPLE RULES OF TRADING
One of the delights in reading "The Big Picture" are the generally
well informed (and often amusing) comments from contributors. You can see the entire post
containing this list here.
| Index | Value | Change Week | Change YTD | Trend | ||||||||||||||||||||||||||||||||||||
|---|---|---|---|---|---|---|---|---|---|---|---|---|---|---|---|---|---|---|---|---|---|---|---|---|---|---|---|---|---|---|---|---|---|---|---|---|---|---|---|---|
| Dow | 12391.2 | 0.96% | 7.03% | Up | ||||||||||||||||||||||||||||||||||||
| NASDAQ | 2833.95 | 0.87% | 6.83% | Up | ||||||||||||||||||||||||||||||||||||
| S&P 500 | 1343.01 | 1.04% | 6.79% | Up | ||||||||||||||||||||||||||||||||||||
| Russell 2000 | 834.82 | 1.55% | 6.53% | Up | ||||||||||||||||||||||||||||||||||||
| Wilshire 5000 | 14193.7 | 1.06% | 6.8% | Up | ||||||||||||||||||||||||||||||||||||
1The Market Signal is derived from our proprietary
market model. The market model is described on the site. 2The site also shows industry rankings based on fundamentals, combined technical and fundamentals, and on price alone. The site also shows daily industry movements. |
||||||||||||||||||||||||||||||||||||||||
# of Breakouts |
Period Average1 |
Max. Gain During Period2 |
Gain at Period Close3 |
|
|---|---|---|---|---|
| This Week | 16 | 14.85 | 8.19% | 4.05% |
| Last Week | 24 | 14.69 | 7.62% | 5.68% |
| 13 Weeks | 221 | 15.92 | 14.76% |
7.44% |
2This represents the return if each stock were bought at its breakout price and sold at its intraday high.
3This represents the return if each stock were bought at its breakout price and sold at the most recent close.
Category |
Symbol |
Company Name |
Expected Gain1 |
|---|---|---|---|
| Best Overall | KOG | Kodiak Oil & Gas Corp. | 107 |
| Top Technical | CTE | SinoTech Energy Limited - ADS | 104 |
| Top Fundamental | UHAL | AMERCO | 43 |
| Top Tech. & Fund. | CMG | Chipotle Mexican Grill, Inc. | 45 |
Category |
Symbol |
Company Name |
Expected Gain1 |
|---|---|---|---|
| Best Overall | HOOK | Craft Brewers Alliance, Inc. | 97 |
| Top Technical | MU | Micron Technology, Inc. | 69 |
| Top Fundamental | DECK | Deckers Outdoor Corporation | 47 |
| Top Tech. & Fund. | DECK | Deckers Outdoor Corporation | 47 |
If you received this newsletter from a friend and you would like to receive it regularly please go to the BreakoutWatch.com site and enter as a Guest. You will then be able to register to receive the newsletter.
Copyright © 2011 NBIcharts, LLC dba BreakoutWatch.com.
All rights reserved.
"
BreakoutWatch," the BreakoutWatch.com "eye" logo, and the
slogan "tomorrow's breakouts today" are service marks of NBIcharts
LLC. All other marks are the property of their respective owners, and are
used for descriptive purposes only.
BreakoutWatch is not affiliated with Investor's Business Daily or with Mr. William O'Neil.
Our site, research and analysis is supported entirely by subscription and is free from advertising.