There was a chart missing from the Top Tip - this has been corrected.
You are receiving this email because
you are or were a BreakoutWatch.com subscriber, or have subscribed to
our weekly newsletter. This newsletter
summarizes the breakout events of the week and provides additional guidance
that does not fit into our daily format. It is published each weekend.
| Market Summary | Weekly Breakout Report | Top Breakout Choices | Top 2nd Chances | New Features | Tip of the Week |
The major indexes gave ground this week in what may be the start of the correction we have been expecting. Although the major indexes recovered somewhat on Thursday and Friday, volume has not yet confirmed that the correction is over.
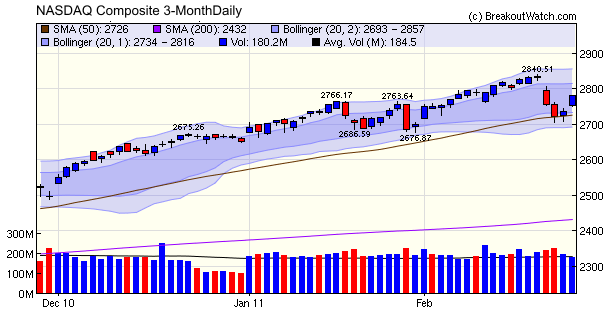
The NASDAQ Composite and Russell 2000 suffered two heavy distribution days on Tuesday and Wednesday but found support at the 50 dma level on Wednesday and Thursday. Although the indexes closed higher on Thursday and again on Friday, each day's volume was lower than the previous day's indicating a lack of strong conviction that the correction is over. In fact, Friday's big gain (1.5% for the NASDAQ) may have been the result of short covering rather than a relief rally.
Friday's GDP numbers were disappointing as they missed the consensus estimate of analysts by a 0.5%. The missed target was mainly the result of rising energy costs and a sharp decrease in spending by states as they try to cope with their budget deficits. The financial difficulties of the states threatens the economic recovery, as does rising energy costs and middle east uncertainty that will take years to reach a new equilibrium. The layoffs of state workers will reduce employment and higher energy costs will reduce the stimulative effect of the 2% payroll tax cut. Whether or not this will have an effect on equity prices remains to be seen, as they have shown little correlation with the state of the economy over the last 18 months.
No new features this week.
Lessons Learned from Trading based on the CwH Backtest Tool
We recently heard from a subscriber who was disappointed with the results of a trading strategy he had developed using the CwH Backtest tool. It is instructive to look at the strategy and difficulties with its practical implementation.
The strategy he used gave many thousands of % profit over the full length period of the backtest (over five years) but in practice over December and January the results were disappointing. The strategy was:
- Buy on breakout alert
- All alerts were buyable provided the volume was at least 2.25 times the average daily volume
- Hold for a maximum of two days and sell at next day's open.
- Use a 1% trailing stop
- Open only one position at a time
If we run a backtest of this strategy over the December - January time frame we get a positive return of 21.1%.
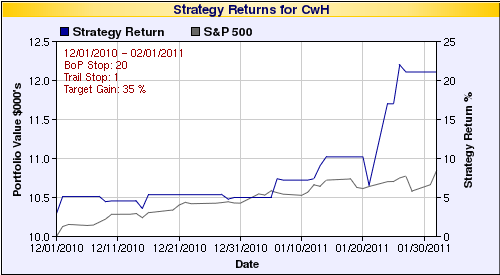
While this looks very satisfactory, there are several points to note:
- Because we are trading only one position at a time, the starting trade and the subsequent sequence has a large influence on the backtest outcome. More on this later.
- The backtest makes most of its profit in late January. Results
were mediocre until then so discouragement could set in early.
- The average return on the trades was only 2.4% making the strategy very susceptible to slippage in either the buy price or the sell price. If the trade is not entered close to the breakout price, or the 1% trailing stop is not executed precisely to close the trade, a potentially winning trade could turn into a losing trade.
- Of eight trades made, six were stopped out by the 1% trailing stop which emphasizes how important the trailing stop execution is.
- Two months is a short time frame to evaluate a strategy that was
built over a five year backtest time frame. During the backtest period,
there would have been several two month periods when the strategy would
have been negative.
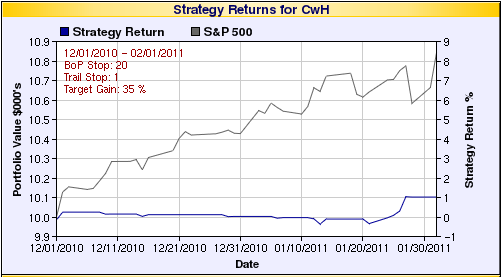
This time the backtest made 19 trades of which 17 were stopped out. We see that the backtest only becomes profitable at the end of January. The number of losses (11) exceeds the number of wins (8) and average profit per trade this time is actually negative (-0.4%). Our margin for error in the buy price or trailing stop execution is now even smaller. This shows us that using a one position strategy it would have been very easy over this short a period to lose on every trade if we were unlucky in the sequence of the trades.
So while the strategy looks very attractive, the problem with it is that with such a short time frame (two days) and tight trailing stops, our profit on each trade is so small that our ability to execute the strategy profitably depends greatly on our ability to execute it with precision. This requires:
- Buy as close to the breakout price as possible and only if you are sure your volume target will be met. Do not rely on the projected volume in the breakout alert alone.
- Once you have opened a position, set a stop loss order with your broker. Be prepared to revise your stop loss order each night based on the highest intraday price reached to date.
- Paper trade your strategy before risking real money to see if these conditions can be met. If not, change the strategy to one with more margin for error. For example, our CwH MTC default strategy when backtested over the last year gave an average profit per trade of 5.1%.
| Index | Value | Change Week | Change YTD | Trend | ||||||||||||||||||||||||||||||||||||
|---|---|---|---|---|---|---|---|---|---|---|---|---|---|---|---|---|---|---|---|---|---|---|---|---|---|---|---|---|---|---|---|---|---|---|---|---|---|---|---|---|
| Dow | 12130.5 | -2.1% | 4.78% | Up | ||||||||||||||||||||||||||||||||||||
| NASDAQ | 2781.05 | -1.87% | 4.83% | Up | ||||||||||||||||||||||||||||||||||||
| S&P 500 | 1319.88 | -1.72% | 4.95% | Up | ||||||||||||||||||||||||||||||||||||
| Russell 2000 | 821.95 | -1.54% | 4.89% | Up | ||||||||||||||||||||||||||||||||||||
| Wilshire 5000 | 13938.5 | -1.8% | 4.88% | Up | ||||||||||||||||||||||||||||||||||||
1The Market Signal is derived from our proprietary
market model. The market model is described on the site. 2The site also shows industry rankings based on fundamentals, combined technical and fundamentals, and on price alone. The site also shows daily industry movements. |
||||||||||||||||||||||||||||||||||||||||
# of Breakouts |
Period Average1 |
Max. Gain During Period2 |
Gain at Period Close3 |
|
|---|---|---|---|---|
| This Week | 7 | 14.69 | 29.82% | 3.07% |
| Last Week | 16 | 14.92 | 9.35% | 2.84% |
| 13 Weeks | 229 | 15.46 | 14.37% |
3.8% |
2This represents the return if each stock were bought at its breakout price and sold at its intraday high.
3This represents the return if each stock were bought at its breakout price and sold at the most recent close.
Category |
Symbol |
Company Name |
Expected Gain1 |
|---|---|---|---|
| Best Overall | MEA | Metalico, Inc. | 107 |
| Top Technical | AVL | Avalon Rare Metals Inc. | 100 |
| Top Fundamental | VSI | Vitamin Shoppe, Inc Common Stock | 51 |
| Top Tech. & Fund. | CMG | Chipotle Mexican Grill, Inc. | 0 |
Category |
Symbol |
Company Name |
Expected Gain1 |
|---|---|---|---|
| Best Overall | MDTH | MedCath Corporation | 101 |
| Top Technical | MDTH | MedCath Corporation | 101 |
| Top Fundamental | MDTH | MedCath Corporation | 101 |
| Top Tech. & Fund. | MDTH | MedCath Corporation | 101 |
If you received this newsletter from a friend and you would like to receive it regularly please go to the BreakoutWatch.com site and enter as a Guest. You will then be able to register to receive the newsletter.
Copyright © 2011 NBIcharts, LLC dba BreakoutWatch.com.
All rights reserved.
"
BreakoutWatch," the BreakoutWatch.com "eye" logo, and the
slogan "tomorrow's breakouts today" are service marks of NBIcharts
LLC. All other marks are the property of their respective owners, and are
used for descriptive purposes only.
BreakoutWatch is not affiliated with Investor's Business Daily or with Mr. William O'Neil.
Our site, research and analysis is supported entirely by subscription and is free from advertising.