| Market Summary | Weekly Breakout Report | Top Breakout Choices | Top 2nd Chances | New Features | Tip of the Week |
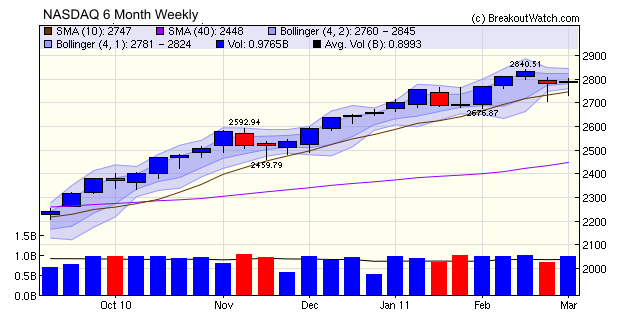
The 'Doji' candlestick pattern exhibited by the NASDAQ Composite over the last two weeks indicates the indecision in the markets as encouraging domestic economic signals are offset by international tensions and rising oil prices which threaten to hold back the recovery.
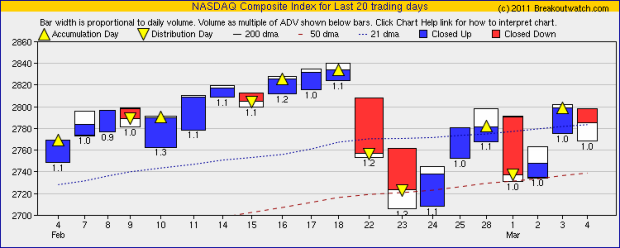
Our equivolume chart for the NASDAQ Composite shows the picture in more detail with an equal number of down to up days over the last two weeks. Distribution days exceeded accumulation days, however, but notice how the index found support at the 50 day average level on 2/23, 2/24/and 3/1.
We are likely to see this indecisive pattern continue until Libya resumes oil shipments or western economies adjust to the reality of higher oil prices at which point the underlying primary upward trend will reassert itself.
Despite the indecision, the number of successful breakout this week was almost twice the 13 week average gaining an average of over 4% by Friday's close - significantly better than the market averages.
You may have noticed that Silver
has topped our best performing Industry for the last many weeks. The
explanation may be found in this NY Times Article.
No new features this week.
Our Zacks Strong Buy Watchlist combines our watchlists with those stocks that are also rated a 'strong buy' by Zacks Investment Research. We have not discussed that watchlist very much lately because, frankly, it has not performed very well. Since last September that has changed and breakouts from this watchlist have done exceptionally well.
This chart (using the Zacks Backtest tool) shows how breakouts from the Zacks Strong Buy Watchlist would have performed over the last 12 months. You can see that performance was mediocre compared to the S&P 500 during the first six months and then started to change dramatically thereafter.
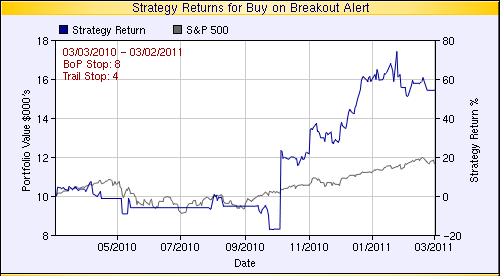
Our Zacks Strong Buy Backtest Tool is available to all readers of our newsletter.
| Index | Value | Change Week | Change YTD | Trend | ||||||||||||||||||||||||||||||||||||
|---|---|---|---|---|---|---|---|---|---|---|---|---|---|---|---|---|---|---|---|---|---|---|---|---|---|---|---|---|---|---|---|---|---|---|---|---|---|---|---|---|
| Dow | 12169.9 | 0.32% | 5.12% | Up | ||||||||||||||||||||||||||||||||||||
| NASDAQ | 2784.67 | 0.13% | 4.97% | Up | ||||||||||||||||||||||||||||||||||||
| S&P 500 | 1321.15 | 0.1% | 5.05% | Up | ||||||||||||||||||||||||||||||||||||
| Russell 2000 | 824.99 | 0.37% | 5.28% | Up | ||||||||||||||||||||||||||||||||||||
| Wilshire 5000 | 13875.3 | -0.45% | 4.4% | Up | ||||||||||||||||||||||||||||||||||||
1The Market Signal is derived from our proprietary
market model. The market model is described on the site. 2The site also shows industry rankings based on fundamentals, combined technical and fundamentals, and on price alone. The site also shows daily industry movements. |
||||||||||||||||||||||||||||||||||||||||
# of Breakouts |
Period Average1 |
Max. Gain During Period2 |
Gain at Period Close3 |
|
|---|---|---|---|---|
| This Week | 28 | 15.46 | 7.39% | 4.37% |
| Last Week | 14 | 14.69 | 2.07% | -0.34% |
| 13 Weeks | 236 | 16.85 | 13.39% |
4.4% |
2This represents the return if each stock were bought at its breakout price and sold at its intraday high.
3This represents the return if each stock were bought at its breakout price and sold at the most recent close.
Category |
Symbol |
Company Name |
Expected Gain1 |
|---|---|---|---|
| Best Overall | PULS | Pulse Electronics Corp | 116 |
| Top Technical | CTE | SinoTech Energy Limited - ADS | 101 |
| Top Fundamental | CMG | Chipotle Mexican Grill, Inc. | 42 |
| Top Tech. & Fund. | CMG | Chipotle Mexican Grill, Inc. | 0 |
Category |
Symbol |
Company Name |
Expected Gain1 |
|---|---|---|---|
| Best Overall | FVE | Five Star Quality Care, Inc. | 102 |
| Top Technical | SCSS | Select Comfort Corp. | 87 |
| Top Fundamental | FVE | Five Star Quality Care, Inc. | 102 |
| Top Tech. & Fund. | FVE | Five Star Quality Care, Inc. | 102 |
If you received this newsletter from a friend and you would like to receive it regularly please go to the BreakoutWatch.com site and enter as a Guest. You will then be able to register to receive the newsletter.
Copyright © 2011 NBIcharts, LLC dba BreakoutWatch.com.
All rights reserved.
"
BreakoutWatch," the BreakoutWatch.com "eye" logo, and the
slogan "tomorrow's breakouts today" are service marks of NBIcharts
LLC. All other marks are the property of their respective owners, and are
used for descriptive purposes only.
BreakoutWatch is not affiliated with Investor's Business Daily or with Mr. William O'Neil.
Our site, research and analysis is supported entirely by subscription and is free from advertising.