| Market Summary | Weekly Breakout Report | Top Breakout Choices | Top 2nd Chances | New Features | Tip of the Week |
Note to new subscribers: each week we assess the progress of the NASDAQ Composite index as most breakouts come from the NASDAQ market.
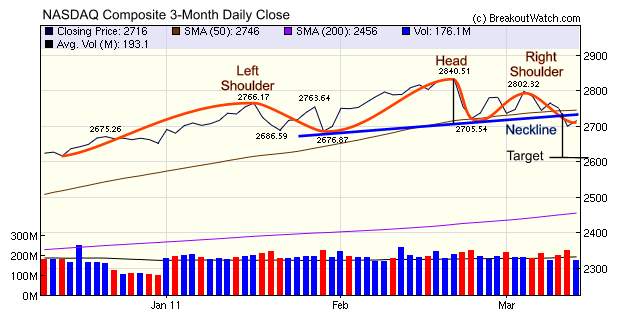
This week the NASDAQ Completed a head and shoulders top (HST) pattern which is usually bearish. A HST is completed when the price line falls through the neckline. Sometimes the pattern is not easily discernible so I have outlined the pattern in red. The neckline is shown in purple. The pattern was completed on Thursday which was also the day the index fell through the 50 day moving average which had established a trading range floor over the last two weeks. Once breached, support turns into resistance, so the 50 day average now represents the threshold for a breakout to the upside.
When assessing the possible downside from a HST pattern we measure the height of the head above the neckline and then subtract that from the point where the price line falls through the neckline. This is shown on the chart and you can see that the target for a downward correction is around 2610. This would represent an 8% correction from the 2840 high which is in-line with typical bull market corrections.
It's spring break here in Hawaii and we are heading to Oregan for a couple of weeks. There will be no daily commentary although the automated daily email will still be produced.
No new features this week
This feature will return in two weeks.
| Index | Value | Change Week | Change YTD | Trend | ||||||||||||||||||||||||||||||||||||
|---|---|---|---|---|---|---|---|---|---|---|---|---|---|---|---|---|---|---|---|---|---|---|---|---|---|---|---|---|---|---|---|---|---|---|---|---|---|---|---|---|
| Dow | 12044.4 | -1.03% | 4.03% | Up | ||||||||||||||||||||||||||||||||||||
| NASDAQ | 2715.61 | -2.48% | 2.36% | Up | ||||||||||||||||||||||||||||||||||||
| S&P 500 | 1304.28 | -1.28% | 3.71% | Up | ||||||||||||||||||||||||||||||||||||
| Russell 2000 | 802.83 | -2.69% | 2.45% | Up | ||||||||||||||||||||||||||||||||||||
| Wilshire 5000 | 13747.1 | -0.92% | 3.44% | Up | ||||||||||||||||||||||||||||||||||||
1The Market Signal is derived
from our proprietary market model. The market model is described on the
site.
2The site also shows industry rankings based on fundamentals, combined technical and fundamentals, and on price alone. The site also shows daily industry movements. |
||||||||||||||||||||||||||||||||||||||||
|
# of Breakouts
|
Period Average1
|
Max. Gain During Period2
|
Gain at Period Close3
|
|
|---|---|---|---|---|
| This Week | 11 | 15.31 | 6.01% | 0.9% |
| Last Week | 28 | 15.46 | 10.34% | -0.58% |
| 13 Weeks | 237 | 16.38 | 13.08% |
0.83% |
2This represents the return if each stock were bought at its breakout price and sold at its intraday high.
3This represents the return if each stock were bought at its breakout price and sold at the most recent close.
|
Category
|
Symbol
|
Company Name
|
Expected Gain1
|
|---|---|---|---|
| Best Overall | BEE | Strategic Hotels & Resorts Inc. | 102 |
| Top Technical | CTE | SinoTech Energy Limited - ADS | 95 |
| Top Fundamental | CMG | Chipotle Mexican Grill, Inc. | 36 |
| Top Tech. & Fund. | CMG | Chipotle Mexican Grill, Inc. | 36 |
|
Category
|
Symbol
|
Company Name
|
Expected Gain1
|
|---|---|---|---|
| Best Overall | AXU | Alexco Resource Corp. (USA) | 96 |
| Top Technical | SSI | Stage Stores, Inc. | 53 |
| Top Fundamental | AXU | Alexco Resource Corp. (USA) | 96 |
| Top Tech. & Fund. | AXU | Alexco Resource Corp. (USA) | 96 |
If you received this newsletter from a friend and you would like to receive it regularly please go to the BreakoutWatch.com site and enter as a Guest. You will then be able to register to receive the newsletter.
Copyright © 2011 NBIcharts, LLC dba BreakoutWatch.com.
All rights reserved.
" BreakoutWatch," the BreakoutWatch.com "eye" logo, and the slogan
"tomorrow's breakouts today" are service marks of NBIcharts LLC. All
other marks are the property of their respective owners, and are used
for descriptive purposes only.
BreakoutWatch is not affiliated with Investor's Business Daily
or with Mr. William O'Neil.
Our site, research and analysis is supported entirely by subscription
and is free from advertising.