| Market Summary | Weekly Breakout Report | Top Breakout Choices | Top 2nd Chances | New Features | Tip of the Week |
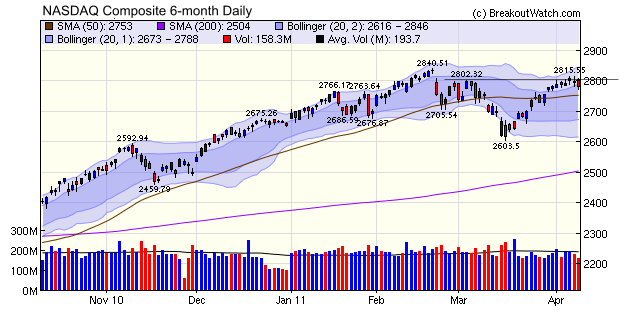
The NASDAQ Composite failed to hold above resistance at 2802 and made a modest loss on the week, as did the other major indexes with the exception of the DJI which showed a modest gain. While the longer term prospects for economic recovery look sound, there will be some short term turbulence as markets continue to fret over the price of oil, turbulence in the Middle East, an end to quantitative easing, rising interest rates in Europe, and possibly soon here at home, and the possibility of a government shutdown (edit: seems to have been averted).
But are these explanations sufficient to
explain what is really happening in the markets? These economic and
geopolitical events seem like rational explanations but when we learn
that the average holding time of a position is 22 seconds, that 73% of
all trades are algorithmic in origin placed by supercomputers
co-located near the exchanges to reduce latency and who engage in quote
stuffing to confuse their algorithmic competitors, do we really have a
grasp on what is happening?
This excellent presentation was a revelation to me. While we all know that programmed trading is extensive, just how pervasive it is was news to me. Trader Yan Ohayon explains that the exchanges are now more concerned with making money for their shareholders than in providing a level playing field.
This excellent presentation was a revelation to me. While we all know that programmed trading is extensive, just how pervasive it is was news to me. Trader Yan Ohayon explains that the exchanges are now more concerned with making money for their shareholders than in providing a level playing field.
No new features this week.
We continue to look for a superior method of detecting bottom reversals but did not complete our research in time for this newsletter. We are looking at stochRSI combined with various volume indicators.
| Index | Value | Change Week | Change YTD | Trend | ||||||||||||||||||||||||||||||||||||
|---|---|---|---|---|---|---|---|---|---|---|---|---|---|---|---|---|---|---|---|---|---|---|---|---|---|---|---|---|---|---|---|---|---|---|---|---|---|---|---|---|
| Dow | 12380 | 0.03% | 6.93% | Up | ||||||||||||||||||||||||||||||||||||
| NASDAQ | 2780.42 | -0.33% | 4.81% | Up | ||||||||||||||||||||||||||||||||||||
| S&P 500 | 1328.17 | -0.32% | 5.61% | Up | ||||||||||||||||||||||||||||||||||||
| Russell 2000 | 840.89 | -0.69% | 7.3% | Up | ||||||||||||||||||||||||||||||||||||
| Wilshire 5000 | 14054.7 | -0.4% | 5.75% | Up | ||||||||||||||||||||||||||||||||||||
1The Market Signal is derived from our proprietary
market model. The market model is described on the site. 2The site also shows industry rankings based on fundamentals, combined technical and fundamentals, and on price alone. The site also shows daily industry movements. |
||||||||||||||||||||||||||||||||||||||||
# of Breakouts |
Period Average1 |
Max. Gain During Period2 |
Gain at Period Close3 |
|
|---|---|---|---|---|
| This Week | 12 | 14.15 | 6.78% | 3.48% |
| Last Week | 16 | 14.38 | 5.11% | 0.87% |
| 13 Weeks | 226 | 15.54 | 12.2% |
4.76% |
2This represents the return if each stock were bought at its breakout price and sold at its intraday high.
3This represents the return if each stock were bought at its breakout price and sold at the most recent close.
Category |
Symbol |
Company Name |
Expected Gain1 |
|---|---|---|---|
| Best Overall | MNTX | Manitex International, Inc. | 123 |
| Top Technical | SVVS | SAVVIS, Inc. | 35 |
| Top Fundamental | NFLX | Netflix, Inc. | 51 |
| Top Tech. & Fund. | CMG | Chipotle Mexican Grill, Inc. | 34 |
Category |
Symbol |
Company Name |
Expected Gain1 |
|---|---|---|---|
| Best Overall | ZIOP | ZIOPHARM Oncology Inc. | 115 |
| Top Technical | LABL | Multi-Color Corporation | 60 |
| Top Fundamental | CAVM | Cavium Networks, Inc. | 43 |
| Top Tech. & Fund. | CAVM | Cavium Networks, Inc. | 43 |
If you received this newsletter from a friend and you would like to receive it regularly please go to the BreakoutWatch.com site and enter as a Guest. You will then be able to register to receive the newsletter.
Copyright © 2011 NBIcharts, LLC dba BreakoutWatch.com.
All rights reserved.
"
BreakoutWatch," the BreakoutWatch.com "eye" logo, and the
slogan "tomorrow's breakouts today" are service marks of NBIcharts
LLC. All other marks are the property of their respective owners, and are
used for descriptive purposes only.
BreakoutWatch is not affiliated with Investor's Business Daily or with Mr. William O'Neil.
Our site, research and analysis is supported entirely by subscription and is free from advertising.