| Market Summary | Weekly Breakout Report | Top Breakout Choices | Top 2nd Chances | New Features | Tip of the Week |
Just a brief market comment this week as the tax deadline approaches.
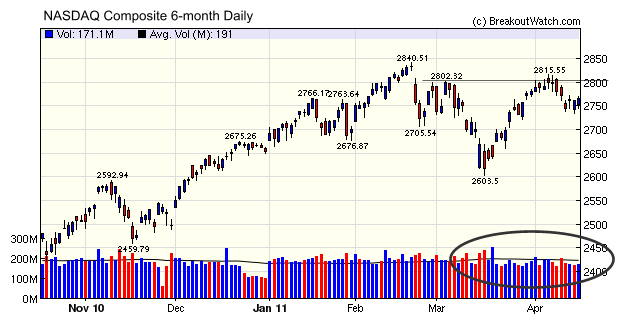
Our 6-month chart of the NASDAQ composite shows that although the NASDAQ has recovered from its mid-March low, it did so on weak volume. Rising prices on lower volume is always a sign of deteriorating market strength, and so it is not surprising that the index failed to hold above resistance at 2802. The flat progress this week reflects continuing weakness as earning season gets off to a disappointing start and rising commodity prices, particularly oil, threaten the strength of the recovery.
The market could go up or down from here. Maybe this will be a good test of our new bottom trend reversal signal :) (See below).
No new features this week.
Coming soon - Facebook App.
Downward Trend Reversal Signal Progress
Tax prep took a bite out of the time to work on this project but progress has been steady. I've identified a promising combination of the stochRSI and Accumulation/Distribution Line which looks good so far.
The value of these two indicators is that the stockRSI is price based while the Acc/Dis indicator is volume based. Although price and volume are not wholly independent, there are advantages to using the acc/dis line to confirm the overbought/oversold indications of the stochRSI. More rigorous backtesting is needed which we will get too next week (hopefully).
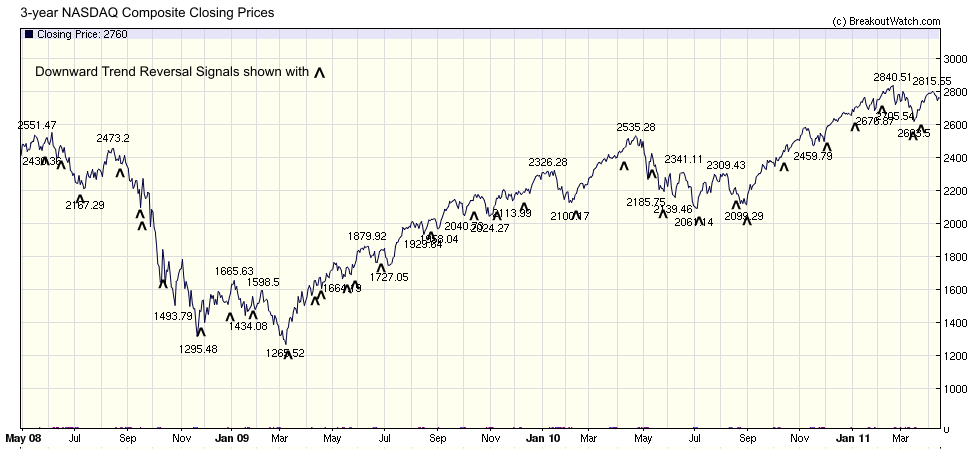
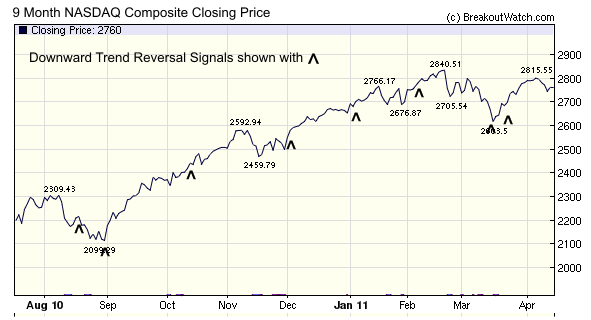
Here is a graphic that shows the signals over the last nine months and there is a bigger chart on the site showing the downward trend reversal signals for the last three years.
| Index | Value | Change Week | Change YTD | Trend | ||||||||||||||||||||||||||||||||||||
|---|---|---|---|---|---|---|---|---|---|---|---|---|---|---|---|---|---|---|---|---|---|---|---|---|---|---|---|---|---|---|---|---|---|---|---|---|---|---|---|---|
| Dow | 12341.8 | -0.31% | 6.6% | Up | ||||||||||||||||||||||||||||||||||||
| NASDAQ | 2764.65 | -0.57% | 4.21% | Up | ||||||||||||||||||||||||||||||||||||
| S&P 500 | 1319.68 | -0.64% | 4.93% | Up | ||||||||||||||||||||||||||||||||||||
| Russell 2000 | 834.98 | -0.7% | 6.55% | Up | ||||||||||||||||||||||||||||||||||||
| Wilshire 5000 | 13964.9 | -0.64% | 5.08% | Up | ||||||||||||||||||||||||||||||||||||
1The Market Signal is derived from our proprietary
market model. The market model is described on the site. 2The site also shows industry rankings based on fundamentals, combined technical and fundamentals, and on price alone. The site also shows daily industry movements. |
||||||||||||||||||||||||||||||||||||||||
# of Breakouts |
Period Average1 |
Max. Gain During Period2 |
Gain at Period Close3 |
|
|---|---|---|---|---|
| This Week | 11 | 12.92 | 5.05% | 4.44% |
| Last Week | 13 | 14.15 | 6.8% | 2.97% |
| 13 Weeks | 222 | 14.54 | 11.72% |
4.49% |
2This represents the return if each stock were bought at its breakout price and sold at its intraday high.
3This represents the return if each stock were bought at its breakout price and sold at the most recent close.
Category |
Symbol |
Company Name |
Expected Gain1 |
|---|---|---|---|
| Best Overall | MDM | Mountain Province Diamonds, Inc. | 115 |
| Top Technical | RDEN | Elizabeth Arden, Inc. | 46 |
| Top Fundamental | BCPC | Balchem Corporation | 42 |
| Top Tech. & Fund. | NFLX | Netflix, Inc. | 54 |
Category |
Symbol |
Company Name |
Expected Gain1 |
|---|---|---|---|
| Best Overall | AKRX | Akorn, Inc. | 114 |
| Top Technical | KONG | KongZhong Corporation (ADR) | 76 |
| Top Fundamental | DHX | DICE HOLDINGS, INC. | 83 |
| Top Tech. & Fund. | DHX | DICE HOLDINGS, INC. | 83 |
If you received this newsletter from a friend and you would like to receive it regularly please go to the BreakoutWatch.com site and enter as a Guest. You will then be able to register to receive the newsletter.
Copyright © 2011 NBIcharts, LLC dba BreakoutWatch.com.
All rights reserved.
"
BreakoutWatch," the BreakoutWatch.com "eye" logo, and the
slogan "tomorrow's breakouts today" are service marks of NBIcharts
LLC. All other marks are the property of their respective owners, and are
used for descriptive purposes only.
BreakoutWatch is not affiliated with Investor's Business Daily or with Mr. William O'Neil.
Our site, research and analysis is supported entirely by subscription and is free from advertising.