| Market Summary | Weekly Breakout Report | Top Breakout Choices | Top 2nd Chances | New Features | Tip of the Week |
As a reminder to new
subscribers, we always focus on the performance of the NASDAQ Composite
as it is stocks on that exchange that have the greatest propensity to
break out.
The NASDAQ, along with the the other major indexes, has had a stellar run since April 19 moving higher each day and recording five accumulation days. Stocks are said to be under accumulation when volume and price both move higher than the previous session and accumulation days are an indication of gathering interest in the stock, or in this case the stocks that compose the index.
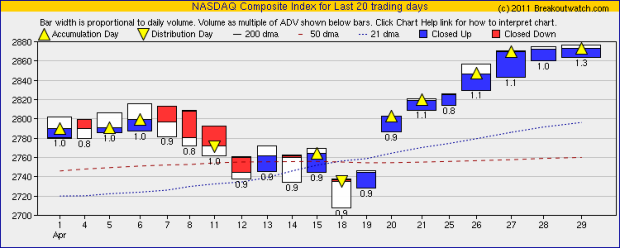
As volume has risen so has the number of breakouts and the rewards thay have brought. There were 20 confirmed breakouts this week that gained an average of 7.75% - a very healthy average gain.
The NASDAQ, along with the the other major indexes, has had a stellar run since April 19 moving higher each day and recording five accumulation days. Stocks are said to be under accumulation when volume and price both move higher than the previous session and accumulation days are an indication of gathering interest in the stock, or in this case the stocks that compose the index.
As volume has risen so has the number of breakouts and the rewards thay have brought. There were 20 confirmed breakouts this week that gained an average of 7.75% - a very healthy average gain.
We were asked by a subscriber to
provide a filter that would select stocks that were within x% of their
50 day moving average. We are pleased to announce that that is now
available as part of our Mine for Candidates > Database Search
function.
In addition to the other selection criteria that have been available as part of the database search since 2003, you can now add an extra filter as shown here:
When combined with the other default criteria, this filter gave the
following result. You will notice that there is now an extra column
under "Technical Data" showing the difference between the 50 dma and
the latest close.
In addition to the other selection criteria that have been available as part of the database search since 2003, you can now add an extra filter as shown here:
Our work on the new trend reversal indicator was interrupted by the development of the delta dm afilter. We hope to return to it next week.
| Index | Value | Change Week | Change YTD | Trend | ||||||||||||||||||||||||||||||||||||
|---|---|---|---|---|---|---|---|---|---|---|---|---|---|---|---|---|---|---|---|---|---|---|---|---|---|---|---|---|---|---|---|---|---|---|---|---|---|---|---|---|
| Dow | 12810.5 | 2.43% | 10.65% | Up | ||||||||||||||||||||||||||||||||||||
| NASDAQ | 2873.54 | 1.89% | 8.32% | Up | ||||||||||||||||||||||||||||||||||||
| S&P 500 | 1363.61 | 1.96% | 8.43% | Up | ||||||||||||||||||||||||||||||||||||
| Russell 2000 | 865.29 | 2.32% | 10.42% | Up | ||||||||||||||||||||||||||||||||||||
| Wilshire 5000 | 14432.2 | 1.97% | 8.59% | Up | ||||||||||||||||||||||||||||||||||||
1The Market Signal is derived
from our proprietary market model. The market model is described on the
site.
2The site also shows industry rankings based on fundamentals, combined technical and fundamentals, and on price alone. The site also shows daily industry movements. |
||||||||||||||||||||||||||||||||||||||||
|
# of Breakouts
|
Period Average1
|
Max. Gain During Period2
|
Gain at Period Close3
|
|
|---|---|---|---|---|
| This Week | 20 | 13.92 | 9.65% | 7.65% |
| Last Week | 15 | 13.77 | 9.06% | 4.81% |
| 13 Weeks | 227 | 14.85 | 14.16% |
7.7% |
2This represents the return if each stock were bought at its breakout price and sold at its intraday high.
3This represents the return if each stock were bought at its breakout price and sold at the most recent close.
|
Category
|
Symbol
|
Company Name
|
Expected Gain1
|
|---|---|---|---|
| Best Overall | SNTA | Synta Pharmaceuticals Corp. | 120 |
| Top Technical | PCOM | Points International Ltd. (USA) | 92 |
| Top Fundamental | SWI | SolarWinds, Inc. | 57 |
| Top Tech. & Fund. | SWI | SolarWinds, Inc. | 57 |
|
Category
|
Symbol
|
Company Name
|
Expected Gain1
|
|---|---|---|---|
| Best Overall | EXAS | EXACT Sciences Corporation | 93 |
| Top Technical | REV | Revlon, Inc. | 56 |
| Top Fundamental | REV | Revlon, Inc. | 56 |
| Top Tech. & Fund. | REV | Revlon, Inc. | 56 |
If you received this newsletter from a friend and you would like to receive it regularly please go to the BreakoutWatch.com site and enter as a Guest. You will then be able to register to receive the newsletter.
Copyright © 2011 NBIcharts, LLC dba BreakoutWatch.com.
All rights reserved.
" BreakoutWatch," the BreakoutWatch.com "eye" logo, and the slogan
"tomorrow's breakouts today" are service marks of NBIcharts LLC. All
other marks are the property of their respective owners, and are used
for descriptive purposes only.
BreakoutWatch is not affiliated with Investor's Business Daily
or with Mr. William O'Neil.
Our site, research and analysis is supported entirely by subscription
and is free from advertising.