| Market Summary | Weekly Breakout Report | Top Breakout Choices | Top 2nd Chances | New Features | Tip of the Week |
The market slide continued on Friday with a distribution day for all the major indexes. As we anticipated last week, the NASDAQ Composite is headed for a test of support at its 200 day moving average and then at its March low of 2603.
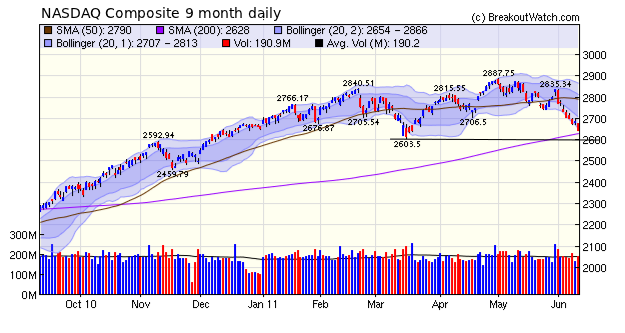
The 200 dma is always a psychologically important level so we may see a bounce off that level before the downward slide resumes.
I believe we have been in a share market bubble and while the bubble may not actually burst, as it did at the end of 2007, there is certainly some air that is going to come out of the balloon. Stock prices had reached their pre-recession levels and yet the level of demand in the economy was nowhere near its 2007 level. Stock prices were supported by cheap money and quantitative easing but with QE2 coming to an end this month, the slide seems likely to continue unless we get some positive economic news.
No new features this week.
Breakdowns Offer the Best Potential for Returns
The number of breakouts this week was just six while there were twenty-nine breakdowns.
When the number of breakdowns vastly overwhelms the number of breakouts then its clear that one should either be on the sidelines or taking some short positions. Betting on breakouts when the market is falling is generally a losing proposition although this week there were several breakouts that gave excellent returns. JVA jumped 84% before closing the week with a 57% gain and PCYC jumped 17% before closing for a 10% gain. For the six breakouts this week the average intraday gain was 20% and the average close was up 12%. Maybe it's tempting on this evidence to think that those stocks that do breakout against the trend can offer better returns, but longer term analysis shows that this is usually a losing proposition.
Instead I would suggest looking for breakdowns from our Flat Base, Head and Shoulders Top and 50 MDA Breakdown lists. Since June 1, there have been sixty-six breakdowns and only five of these are above their breakdown price. Some of them are well below it, as the following table shows.
| Date | Symbol | List | B'down Price | Last Close | Gain % at Last Close |
|---|---|---|---|---|---|
| 6/1/2011 | TZOO | SS | 73.18 | 57.47 | 27.30% |
| 6/7/2011 | PBY | SS | 13.5 | 10.61 | 27.20% |
| 6/1/2011 | BKD | HS | 25.55 | 22.59 | 13.10% |
| 6/3/2011 | DECK | HS | 85.8 | 77.66 | 10.50% |
| 6/2/2011 | ICON | HS | 23.46 | 21.45 | 9.40% |
| 6/1/2011 | CLR | HS | 65.72 | 60.31 | 9.00% |
| 6/1/2011 | VPHM | HS | 19.32 | 17.76 | 8.80% |
| 6/2/2011 | EXXI | HS | 32.73 | 30.43 | 7.60% |
| 6/3/2011 | ACAS | HS | 9.38 | 8.75 | 7.20% |
| 6/1/2011 | DDM | HS | 62.45 | 58.54 | 6.70% |
| 6/2/2011 | BDJ | FB | 8.64 | 8.12 | 6.40% |
| 6/6/2011 | NVTL | SS | 5.33 | 5.01 | 6.40% |
| 6/1/2011 | XCO | FB | 20.1 | 18.97 | 6.00% |
| 6/3/2011 | AZPN | HS | 16.24 | 15.33 | 5.90% |
| 6/1/2011 | CAT | HS | 102.16 | 96.79 | 5.50% |
| 6/3/2011 | CAT | HS | 102.16 | 96.79 | 5.50% |
| 6/2/2011 | OAS | SS | 28.48 | 27.09 | 5.10% |
| 6/2/2011 | UGI | SS | 32.34 | 30.92 | 4.60% |
| 6/2/2011 | AEL | HS | 12.67 | 12.13 | 4.50% |
| 6/3/2011 | CE | HS | 48.62 | 46.65 | 4.20% |
| 6/2/2011 | PSLV | HS | 16.78 | 16.12 | 4.10% |
| 6/6/2011 | EXPR | HS | 20 | 19.31 | 3.60% |
| 6/3/2011 | IJJ | FB | 83.39 | 80.55 | 3.50% |
| 6/6/2011 | FTK | HS | 8.44 | 8.17 | 3.30% |
| 6/8/2011 | SNPS | FB | 26.12 | 25.28 | 3.30% |
| 6/1/2011 | BWA | HS | 70.07 | 67.93 | 3.20% |
| 6/1/2011 | CNX | HS | 50.34 | 48.83 | 3.10% |
| 6/6/2011 | ATW | HS | 41.51 | 40.28 | 3.10% |
| 6/6/2011 | IJT | FB | 78.15 | 75.77 | 3.10% |
| 6/6/2011 | AGP | HS | 67.31 | 65.36 | 3.00% |
| 6/1/2011 | FTK | HS | 8.41 | 8.17 | 2.90% |
| 6/1/2011 | ATLS | HS | 24.51 | 23.85 | 2.80% |
| 6/3/2011 | ICF | FB | 72.09 | 70.12 | 2.80% |
| 6/10/2011 | ATLS | HS | 24.51 | 23.85 | 2.80% |
| 6/6/2011 | FNX | FB | 34.62 | 33.73 | 2.60% |
| 6/6/2011 | IJJ | FB | 82.68 | 80.55 | 2.60% |
| 6/9/2011 | IYR | FB | 60 | 58.48 | 2.60% |
| 6/10/2011 | MOVE | SS | 2.15 | 2.1 | 2.40% |
| 6/1/2011 | ASX | HS | 6.13 | 6 | 2.20% |
| 6/6/2011 | ADX | FB | 10.89 | 10.66 | 2.20% |
| 6/10/2011 | ASX | HS | 6.13 | 6 | 2.20% |
| 6/1/2011 | PNC | FB | 60.34 | 59.07 | 2.10% |
| 6/3/2011 | AN | SS | 34.02 | 33.33 | 2.10% |
| 6/6/2011 | CWB | FB | 41.44 | 40.61 | 2.00% |
| 6/10/2011 | PKO | FB | 28.4 | 27.83 | 2.00% |
| 6/3/2011 | UGI | SS | 31.5 | 30.92 | 1.90% |
| 6/2/2011 | EXAS | HS | 7.29 | 7.17 | 1.70% |
| 6/2/2011 | IFF | HS | 62.55 | 61.48 | 1.70% |
| 6/10/2011 | EXAS | HS | 7.29 | 7.17 | 1.70% |
| 6/6/2011 | HNT | HS | 30.69 | 30.2 | 1.60% |
| 6/2/2011 | SLV | HS | 35.74 | 35.25 | 1.40% |
| 6/2/2011 | SIVR | HS | 36.43 | 35.96 | 1.30% |
| 6/3/2011 | CNW | HS | 36.95 | 36.52 | 1.20% |
| 6/10/2011 | IBB | FB | 104.5 | 103.31 | 1.20% |
| 6/10/2011 | TR | FB | 28.08 | 27.75 | 1.20% |
| 6/2/2011 | WABC | FB | 48.03 | 47.66 | 0.80% |
| 6/6/2011 | HS | HS | 41.44 | 41.17 | 0.70% |
| 6/10/2011 | CB | FB | 63.95 | 63.6 | 0.60% |
| 6/1/2011 | AKS | HS | 15.26 | 15.215 | 0.30% |
| 6/6/2011 | FXZ | FB | 24.32 | 24.25 | 0.30% |
| 6/10/2011 | LG | FB | 36.09 | 36.1 | 0.00% |
| 6/10/2011 | GAM | FB | 27.3 | 27.38 | −0.30% |
| 6/7/2011 | WTI | HS | 23.34 | 23.46 | −0.50% |
| 6/7/2011 | MSEX | FB | 17.78 | 18.02 | −1.30% |
| 6/6/2011 | CVH | HS | 33.5 | 34.02 | −1.50% |
| 6/2/2011 | ZQK | SS | 4.4 | 4.56 | −3.50% |
| Average Gain |
3.95% | ||||
| Index | Value | Change Week | Change YTD | Trend | ||||||||||||||||||||||||||||||||||||
|---|---|---|---|---|---|---|---|---|---|---|---|---|---|---|---|---|---|---|---|---|---|---|---|---|---|---|---|---|---|---|---|---|---|---|---|---|---|---|---|---|
| Dow | 11951.9 | -1.64% | 3.23% | Up | ||||||||||||||||||||||||||||||||||||
| NASDAQ | 2643.73 | -3.26% | -0.34% | Down | ||||||||||||||||||||||||||||||||||||
| S&P 500 | 1270.98 | -2.24% | 1.06% | Up | ||||||||||||||||||||||||||||||||||||
| Russell 2000 | 779.54 | -3.54% | -0.52% | Down | ||||||||||||||||||||||||||||||||||||
| Wilshire 5000 | 13404.6 | -2.46% | 0.86% | Up | ||||||||||||||||||||||||||||||||||||
1The Market Signal is derived from our proprietary
market model. The market model is described on the site. 2The site also shows industry rankings based on fundamentals, combined technical and fundamentals, and on price alone. The site also shows daily industry movements. |
||||||||||||||||||||||||||||||||||||||||
# of Breakouts |
Period Average1 |
Max. Gain During Period2 |
Gain at Period Close3 |
|
|---|---|---|---|---|
| This Week | 6 | 11.46 | 20.85% | 12.09% |
| Last Week | 19 | 11.92 | 2.99% | -4.56% |
| 13 Weeks | 197 | 12.38 | 10.31% |
-3.15% |
2This represents the return if each stock were bought at its breakout price and sold at its intraday high.
3This represents the return if each stock were bought at its breakout price and sold at the most recent close.
Category |
Symbol |
Company Name |
Expected Gain1 |
|---|---|---|---|
| Best Overall | CLFD | Clearfield, Inc. | 118 |
| Top Technical | BIOS | BioScrip Inc. | 77 |
| Top Fundamental | BUCY | Bucyrus International, Inc. | 7 |
| Top Tech. & Fund. | BPI | Bridgepoint Education, Inc. | 43 |
Category |
Symbol |
Company Name |
Expected Gain1 |
|---|---|---|---|
| Best Overall | SQNM | Sequenom, Inc. | 85 |
| Top Technical | CORN | Teucrium Corn Fund | 33 |
| Top Fundamental | SQNM | Sequenom, Inc. | 85 |
| Top Tech. & Fund. | SQNM | Sequenom, Inc. | 85 |
If you received this newsletter from a friend and you would like to receive it regularly please go to the BreakoutWatch.com site and enter as a Guest. You will then be able to register to receive the newsletter.
Copyright © 2011 NBIcharts, LLC dba BreakoutWatch.com.
All rights reserved.
"
BreakoutWatch," the BreakoutWatch.com "eye" logo, and the
slogan "tomorrow's breakouts today" are service marks of NBIcharts
LLC. All other marks are the property of their respective owners, and are
used for descriptive purposes only.
BreakoutWatch is not affiliated with Investor's Business Daily or with Mr. William O'Neil.
Our site, research and analysis is supported entirely by subscription and is free from advertising.