| Market Summary | Weekly Breakout Report | Top Breakout Choices | Top 2nd Chances | New Features | Tip of the Week |
The NASDAQ Composite has made a striking recovery over the last two
weeks with the index gaining more in percentage terms than the other
major indexes we follow. While we were
expecting the consolidation to the downside to continue, the improved likelihood of
Greece avoiding default (in the short term) has allowed the index to
recover to above its 50 dma. The
rise has been so rapid that the moving average based trend algorithm
for this index remains at down while the others are showing a positive
up trend.
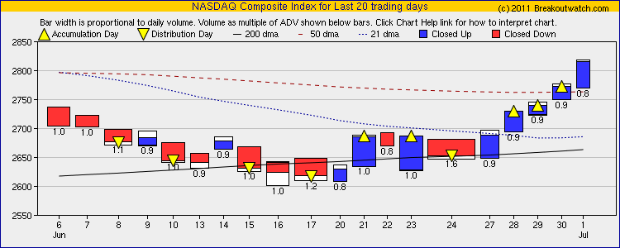
Our equivolume chart shows the index has recorded three accumulation
days this week although the volume each day has disappointed at only
about 90% of the 50 day average. That may be due to the approaching
long weekend and summer vacations, but we would still like to see
higher volume if the rally is to be sustained.
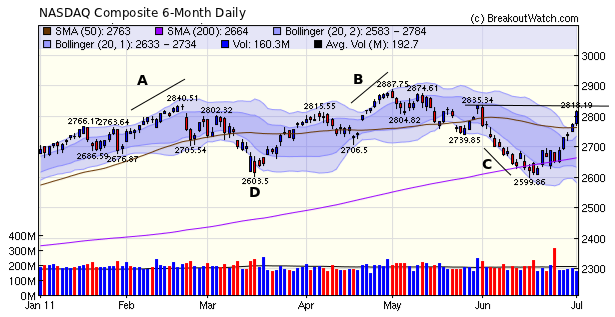
The daily chart shows the index has
risen well above its 2-standard deviation Bollinger Band which is
likely unsustainable for more than a few days. While it is common to
see an index track the 2-sd BB for several days as it moves higher (see
A and B below) or lower (C), it is unusual for it to stay outside the
2-sd band for long (D). The index now faces resistance at 2835 but could reverse to test support at 2740.
We wish all our readers a happy and safe Independence Day weekend.
At the request of a subscriber we have added an ability to download our complete industry structure. This is reached from the Evaluate > Industry Analysis > Industry Browser menu choice. Click the download button and you will get a file in .csv (comma separated values) format suitable for importing into any spreadsheet application.
The download also include for each stock, rank in industry, RS Rank, and our CET, CEF and CE rating.
This feature will return next week.
| Index | Value | Change Week | Change YTD | Trend | ||||||||||||||||||||||||||||||||||||
|---|---|---|---|---|---|---|---|---|---|---|---|---|---|---|---|---|---|---|---|---|---|---|---|---|---|---|---|---|---|---|---|---|---|---|---|---|---|---|---|---|
| Dow | 12582.8 | 5.43% | 8.68% | Up | ||||||||||||||||||||||||||||||||||||
| NASDAQ | 2816.03 | 6.15% | 6.15% | Down | ||||||||||||||||||||||||||||||||||||
| S&P 500 | 1339.67 | 5.61% | 6.52% | Up | ||||||||||||||||||||||||||||||||||||
| Russell 2000 | 840.04 | 5.3% | 7.2% | Up | ||||||||||||||||||||||||||||||||||||
| Wilshire 5000 | 14172.2 | 5.57% | 6.64% | Up | ||||||||||||||||||||||||||||||||||||
1The Market Signal is derived from our proprietary
market model. The market model is described on the site. 2The site also shows industry rankings based on fundamentals, combined technical and fundamentals, and on price alone. The site also shows daily industry movements. |
||||||||||||||||||||||||||||||||||||||||
# of Breakouts |
Period Average1 |
Max. Gain During Period2 |
Gain at Period Close3 |
|
|---|---|---|---|---|
| This Week | 14 | 11.69 | 4.45% | 3.56% |
| Last Week | 21 | 11.38 | 5.93% | 4.17% |
| 13 Weeks | 179 | 12.69 | 10.78% |
3.33% |
2This represents the return if each stock were bought at its breakout price and sold at its intraday high.
3This represents the return if each stock were bought at its breakout price and sold at the most recent close.
Category |
Symbol |
Company Name |
Expected Gain1 |
|---|---|---|---|
| Best Overall | OCZ | OCZ Technology Group Inc. | 104 |
| Top Technical | HCCI | Heritage-Crystal Clean, Inc. | 62 |
| Top Fundamental | ACOM | Ancestry.com Inc | 45 |
| Top Tech. & Fund. | GHDX | Genomic Health, Inc. | 38 |
Category |
Symbol |
Company Name |
Expected Gain1 |
|---|---|---|---|
| Best Overall | CLFD | Clearfield, Inc. | 113 |
| Top Technical | CLFD | Clearfield, Inc. | 113 |
| Top Fundamental | PCP | Precision Castparts Corp. | 20 |
| Top Tech. & Fund. | PCP | Precision Castparts Corp. | 20 |
If you received this newsletter from a friend and you would like to receive it regularly please go to the BreakoutWatch.com site and enter as a Guest. You will then be able to register to receive the newsletter.
Copyright © 2011 NBIcharts, LLC dba BreakoutWatch.com.
All rights reserved.
"
BreakoutWatch," the BreakoutWatch.com "eye" logo, and the
slogan "tomorrow's breakouts today" are service marks of NBIcharts
LLC. All other marks are the property of their respective owners, and are
used for descriptive purposes only.
BreakoutWatch is not affiliated with Investor's Business Daily or with Mr. William O'Neil.
Our site, research and analysis is supported entirely by subscription and is free from advertising.