| Market Summary | Weekly Breakout Report | Top Breakout Choices | Top 2nd Chances | New Features | Tip of the Week |
Friday's employment numbers and encouraging news from Europe (we've heard that before) allowed the DJI to close higher on Friday while the other major indexes remained in the red, despite an afternoon rally. The good news is that the indexes closed much higher than their intra-day lows. On this basis a CAN SLIM* believer would start counting this as day one of a potential rally. The prospects are not rosy, however, as we shall see.
As I write this, I learn that Standard and Poor's has downgraded the rating of long-term federal debt to AA+ from AAA. While the impact of this is far from clear, it can hardly be positive. With 48 hours before the Asian markets open, there is time for a sober assessment by the international markets so the impact on domestic markets may not be as severe as if the markets were opening tomorrow.
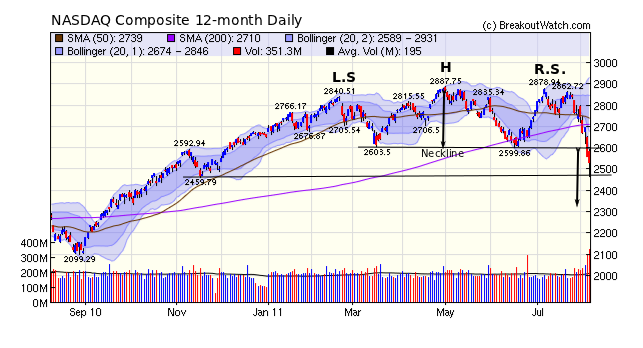
The NASDAQ Composite completed a head and shoulders top pattern on Thursday when the index closed below its neckline level of 2600. The standard method for estimating the possible fall from the neckline price indicates that the index could fall to around 2310. That's a further 11% from today's close and a 20% drop from the July 7 high water mark. In our analysis of the probability that a H&S Top will fall to its target level, we found that the target is met in 59% of cases (see Head & Shoulders Top Target Success Rates), so there is certainly a heavy downside risk.
We recorded 120 confirmed breakdowns
this week with an average loss (gain if you were short) of 7.5%. As you
can see from the following table, many stocks provided a very nice
return if you were fortunate enough to be short them.
| B'down Date | Symbol | Base | Loss % at Last Close |
Loss % at Intraday Low |
| 8/2/2011 | WLT | SS | 60.10% | 64.30% |
| 8/2/2011 | FOE | SS | 40.80% | 43.80% |
| 8/3/2011 | TTI | SS | 25.90% | 28.70% |
| 8/4/2011 | WTW | SS | 23.40% | 32.50% |
| 8/1/2011 | EXXI | HS | 22.50% | 31.60% |
| 8/2/2011 | GLDD | SS | 21.10% | 23.40% |
| 8/5/2011 | WTW | SS | 20.70% | 29.50% |
| 8/2/2011 | LYB | HS | 19.70% | 31.30% |
| 8/2/2011 | WFT | HS | 17.60% | 22.80% |
| 8/3/2011 | GLDD | SS | 17.10% | 19.40% |
| 8/4/2011 | SVM | SS | 16.60% | 24.40% |
| 8/2/2011 | ETFC | HS | 16.00% | 20.60% |
| 8/4/2011 | CECO | HS | 15.80% | 16.30% |
| 8/2/2011 | XBI | FB | 15.70% | 16.40% |
| 8/2/2011 | ARMH | HS | 13.20% | 16.80% |
| 8/3/2011 | PXD | SS | 13.20% | 17.40% |
| 8/3/2011 | ACAS | SS | 12.70% | 16.10% |
| 8/2/2011 | IBB | FB | 12.20% | 13.60% |
| 8/2/2011 | SQM | HS | 11.60% | 16.50% |
| 8/4/2011 | RDC | SS | 11.60% | 17.80% |
| 8/4/2011 | GMO | SS | 11.30% | 23.00% |
| 8/4/2011 | SGMS | HS | 11.20% | 14.70% |
| 8/2/2011 | SGMS | HS | 11.10% | 14.60% |
| 8/4/2011 | CSE | SS | 11.00% | 11.00% |
| 8/2/2011 | CMI | SS | 10.70% | 16.00% |
| 8/4/2011 | IVN | SS | 10.60% | 16.80% |
| 8/4/2011 | ACAS | SS | 10.40% | 13.70% |
| 8/4/2011 | TEN | HS | 10.40% | 17.70% |
| 8/4/2011 | CXO | SS | 10.20% | 13.40% |
| 8/4/2011 | PAAS | SS | 9.50% | 13.30% |
| 8/2/2011 | DSW | HS | 9.00% | 14.70% |
| 8/4/2011 | DSW | HS | 9.00% | 14.70% |
| 8/2/2011 | IWR | FB | 8.90% | 10.60% |
| 8/2/2011 | TWX | HS | 8.80% | 11.40% |
| 8/3/2011 | FRI | FB | 8.80% | 9.40% |
| 8/3/2011 | VNQ | FB | 8.00% | 8.90% |
| 8/3/2011 | IYR | FB | 7.90% | 8.80% |
| 8/4/2011 | APC | SS | 7.90% | 13.30% |
| 8/1/2011 | RSP | FB | 7.80% | 9.80% |
| 8/2/2011 | TWX | FB | 7.80% | 9.40% |
| 8/2/2011 | RSP | FB | 7.70% | 9.60% |
| 8/1/2011 | FEX | FB | 7.60% | 9.70% |
| 8/5/2011 | CSE | SS | 7.60% | 7.60% |
| 8/2/2011 | FEX | FB | 7.30% | 9.50% |
| 8/2/2011 | FXU | FB | 7.20% | 8.90% |
| 8/3/2011 | RWO | FB | 7.20% | 8.60% |
| 8/5/2011 | PPO | SS | 6.90% | 12.10% |
| 8/2/2011 | CMCSA | HS | 6.60% | 10.00% |
| 8/1/2011 | PWV | FB | 6.40% | 8.80% |
| 8/4/2011 | SIMG | SS | 6.40% | 9.10% |
| 8/4/2011 | WSH | HS | 6.40% | 8.70% |
| 8/3/2011 | PEG | SS | 6.30% | 8.00% |
| 8/4/2011 | POT | SS | 6.20% | 11.00% |
| 8/1/2011 | DISCA | FB | 6.10% | 9.00% |
| 8/3/2011 | CYN | FB | 6.00% | 6.40% |
| 8/2/2011 | IWB | FB | 5.80% | 7.90% |
| 8/2/2011 | VTI | FB | 5.80% | 7.90% |
| 8/3/2011 | SCHF | FB | 5.80% | 8.00% |
| 8/3/2011 | CAB | SS | 5.60% | 8.50% |
| 8/3/2011 | SCHE | FB | 5.60% | 8.00% |
| 8/3/2011 | VEU | FB | 5.40% | 8.40% |
| 8/1/2011 | SDY | FB | 5.30% | 7.30% |
| 8/1/2011 | VIG | FB | 5.30% | 7.50% |
| 8/2/2011 | BRFS | HS | 5.30% | 11.90% |
| 8/2/2011 | ETR | FB | 5.30% | 7.10% |
| 8/2/2011 | VOO | FB | 5.20% | 7.40% |
| 8/3/2011 | VT | FB | 5.20% | 7.70% |
| 8/3/2011 | VWO | FB | 5.20% | 7.80% |
| 8/3/2011 | VXUS | FB | 5.20% | 8.30% |
| 8/3/2011 | SCHB | FB | 5.10% | 7.40% |
| 8/4/2011 | ELGX | HS | 5.10% | 11.00% |
| 8/1/2011 | FVD | FB | 5.00% | 7.10% |
| 8/3/2011 | VEA | FB | 5.00% | 8.20% |
| 8/3/2011 | VV | FB | 5.00% | 7.20% |
| 8/4/2011 | VWO | FB | 5.00% | 7.60% |
| 8/3/2011 | SCHX | FB | 4.80% | 7.10% |
| 8/4/2011 | SCHE | FB | 4.80% | 7.30% |
| 8/3/2011 | IVV | FB | 4.60% | 6.90% |
| 8/3/2011 | VOO | FB | 4.60% | 6.80% |
| 8/3/2011 | SPY | FB | 4.50% | 6.90% |
| 8/2/2011 | VYM | FB | 4.40% | 6.80% |
| 8/5/2011 | SIMG | SS | 4.30% | 6.90% |
| 8/4/2011 | NTG | FB | 4.20% | 10.00% |
| 8/5/2011 | WFT | SS | 3.70% | 8.20% |
| 8/3/2011 | DIA | FB | 3.60% | 6.00% |
| 8/3/2011 | IWF | FB | 3.60% | 6.10% |
| 8/3/2011 | OEF | FB | 3.40% | 5.90% |
| 8/5/2011 | AWF | FB | 3.40% | 7.20% |
| 8/5/2011 | MSZ | FB | 3.30% | 6.80% |
| 8/2/2011 | WEC | FB | 2.90% | 5.10% |
| 8/3/2011 | PBJ | FB | 2.60% | 5.40% |
| 8/4/2011 | FXG | FB | 2.60% | 5.30% |
| 8/2/2011 | AGN | FB | 2.50% | 5.60% |
| 8/4/2011 | XXV | FB | 2.00% | 3.00% |
| 8/5/2011 | LVS | SS | 2.00% | 10.10% |
| 8/5/2011 | NGD | SS | 2.00% | 8.90% |
| 8/3/2011 | XLU | FB | 1.70% | 3.50% |
| 8/4/2011 | IPGP | HS | 1.70% | 6.70% |
| 8/5/2011 | FFC | FB | 1.70% | 7.80% |
| 8/5/2011 | RFMD | SS | 1.70% | 5.60% |
| 8/5/2011 | WES | FB | 1.70% | 9.10% |
| 8/3/2011 | WMT | FB | 1.60% | 4.00% |
| 8/4/2011 | GDP | SS | 1.50% | 6.20% |
| 8/5/2011 | PGX | FB | 1.50% | 5.50% |
| 8/3/2011 | AEP | FB | 1.20% | 4.00% |
| 8/5/2011 | INT | SS | 1.10% | 5.90% |
| 8/5/2011 | JGT | FB | 1.10% | 3.40% |
| 8/5/2011 | TTT | FB | 1.10% | 3.80% |
| 8/4/2011 | PGN | FB | 1.00% | 2.40% |
| 8/2/2011 | INT | SS | 0.90% | 5.60% |
| 8/5/2011 | WYNN | SS | 0.80% | 6.20% |
| 8/4/2011 | AEE | FB | 0.60% | 3.00% |
| 8/5/2011 | ERC | FB | 0.50% | 4.40% |
| 8/3/2011 | NSM | SS | 0.40% | 1.00% |
| 8/5/2011 | EDD | FB | 0.40% | 2.60% |
| 8/4/2011 | NSM | SS | 0.30% | 0.90% |
| 8/4/2011 | UNS | FB | −0.40% | 2.50% |
| 8/5/2011 | BWF | FB | −0.70% | 1.40% |
| 8/5/2011 | PHB | FB | −0.70% | 1.00% |
| 8/5/2011 | NJR | FB | −1.80% | 0.90% |
| Average Loss |
7.49% | |||
Access from Mobile Devices
If you access the site from your mobile device you will now receive a menu that is easily navigable after login.
The menu will take you to our regular formatted pages so you will need to pan on smaller devices.
You get back to the menu by clicking the menu button that will appear at the top of each page.
If the technical analysis of the NASDAQ presented above proves even partly correct, there will be some profitable opportunities if you go short.
We have three watchlists that provide stocks that present shorting opportunities. You may wish to review the methodology we use to develop each list and also the trading hints for each.
| Watchlist (Acronym) |
Methodology LInk |
Trading Hints Link |
| 50 DMA Breakdown (SS) |
methodology |
trading hints |
| Head & Shoulders Top (HST) |
methodology |
trading hints |
| Flat Base (FB) |
methodology |
no trading hint |
| Index | Value | Change Week | Change YTD | Trend | ||||||||||||||||||||||||||||||||||||
|---|---|---|---|---|---|---|---|---|---|---|---|---|---|---|---|---|---|---|---|---|---|---|---|---|---|---|---|---|---|---|---|---|---|---|---|---|---|---|---|---|
| Dow | 11444.6 | -5.75% | -1.15% | Up | ||||||||||||||||||||||||||||||||||||
| NASDAQ | 2532.41 | -8.13% | -4.54% | Down | ||||||||||||||||||||||||||||||||||||
| S&P 500 | 1199.38 | -7.19% | -4.63% | Up | ||||||||||||||||||||||||||||||||||||
| Russell 2000 | 714.63 | -10.34% | -8.81% | Down | ||||||||||||||||||||||||||||||||||||
| Wilshire 5000 | 12564.8 | -7.9% | -5.46% | Up | ||||||||||||||||||||||||||||||||||||
1The Market Signal is derived from our proprietary
market model. The market model is described on the site. 2The site also shows industry rankings based on fundamentals, combined technical and fundamentals, and on price alone. The site also shows daily industry movements. |
||||||||||||||||||||||||||||||||||||||||
# of Breakouts |
Period Average1 |
Max. Gain During Period2 |
Gain at Period Close3 |
|
|---|---|---|---|---|
| This Week | 9 | 12.62 | 4.23% | -3.57% |
| Last Week | 40 | 13 | 1.62% | -10.16% |
| 13 Weeks | 283 | 14 | 7.22% |
-10.55% |
2This represents the return if each stock were bought at its breakout price and sold at its intraday high.
3This represents the return if each stock were bought at its breakout price and sold at the most recent close.
Category |
Symbol |
Company Name |
Expected Gain1 |
|---|---|---|---|
| Best Overall | LSI | LSI Corporation | 89 |
| Top Technical | TSRX | Trius Therapeutics, Inc. | 70 |
| Top Fundamental | ZNH | China Southern Airlines Limited (ADR) | 37 |
| Top Tech. & Fund. | ZNH | China Southern Airlines Limited (ADR) | 37 |
Category |
Symbol |
Company Name |
Expected Gain1 |
|---|---|---|---|
| Best Overall | EM | Emdeon Inc. Class A Common Stock | 77 |
| Top Technical | DBP | PowerShares DB Precious Metals Fd (ETF) | 16 |
| Top Fundamental | AUY | Yamana Gold Inc. (USA) | 62 |
| Top Tech. & Fund. | AUY | Yamana Gold Inc. (USA) | 62 |
If you received this newsletter from a friend and you would like to receive it regularly please go to the BreakoutWatch.com site and enter as a Guest. You will then be able to register to receive the newsletter.
Copyright © 2011 NBIcharts, LLC dba BreakoutWatch.com.
All rights reserved.
"
BreakoutWatch," the BreakoutWatch.com "eye" logo, and the
slogan "tomorrow's breakouts today" are service marks of NBIcharts
LLC. All other marks are the property of their respective owners, and are
used for descriptive purposes only.
BreakoutWatch is not affiliated with Investor's Business Daily or with Mr. William O'Neil.
Our site, research and analysis is supported entirely by subscription and is free from advertising.