| Market Summary | Weekly Breakout Report | Top Breakout Choices | Top 2nd Chances | New Features | Tip of the Week |
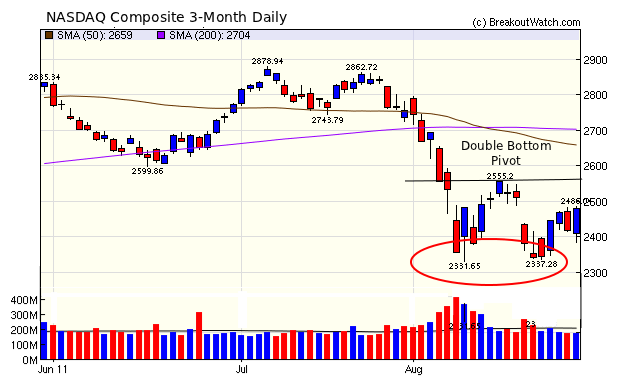
The major indexes made strong gains with the more volatile NASDAQ Composite and Russell 2000 out pacing the large cap indexes. Volumes have come down from their extraordinarily high levels of three weeks ago but were below the 50 day average this week indicating that support for the rally is weak.
As the chart shows, the NASDAQ formed a double bottom and needs to rise above resistance at 2555 before the chart turns bullish.
While some may think this is a buying opportunity, for the most part, stocks are well below their breakout levels for our long position watchlists. It is therefore not surprising that although the gains this week have been strong, only eight stocks could make our confirmed breakout list.
While upside breakouts were scarce, breakdowns were even scarcer with just five breakdowns being confirmed.
No new features this week.
Best to keep your powder dry until a positive, or clearly negative, trend establishes itself.
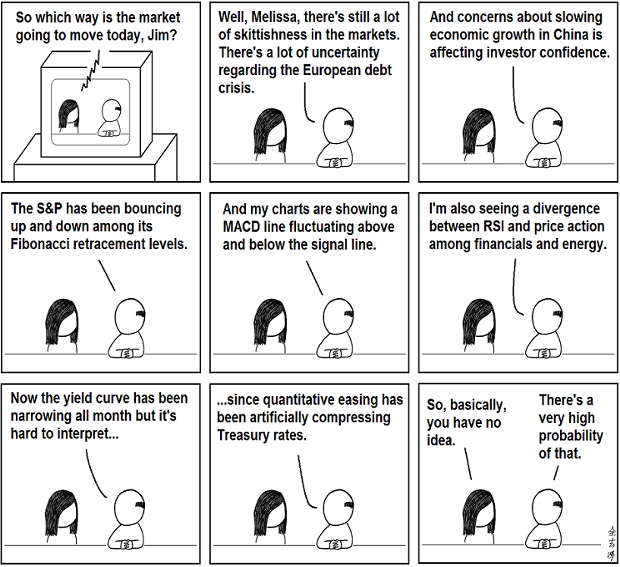
Hat tip Abstruse Goose
| Index | Value | Change Week | Change YTD | Trend | ||||||||||||||||||||||||||||||||||||
|---|---|---|---|---|---|---|---|---|---|---|---|---|---|---|---|---|---|---|---|---|---|---|---|---|---|---|---|---|---|---|---|---|---|---|---|---|---|---|---|---|
| Dow | 11284.5 | 4.32% | -2.53% | Up | ||||||||||||||||||||||||||||||||||||
| NASDAQ | 2479.85 | 5.89% | -6.52% | Down | ||||||||||||||||||||||||||||||||||||
| S&P 500 | 1176.8 | 4.74% | -6.43% | Down | ||||||||||||||||||||||||||||||||||||
| Russell 2000 | 691.79 | 6.15% | -11.72% | Down | ||||||||||||||||||||||||||||||||||||
| Wilshire 5000 | 12313.8 | 4.95% | -7.35% | Down | ||||||||||||||||||||||||||||||||||||
1The Market Signal is derived from our proprietary
market model. The market model is described on the site. 2The site also shows industry rankings based on fundamentals, combined technical and fundamentals, and on price alone. The site also shows daily industry movements. |
||||||||||||||||||||||||||||||||||||||||
# of Breakouts |
Period Average1 |
Max. Gain During Period2 |
Gain at Period Close3 |
|
|---|---|---|---|---|
| This Week | 8 | 11.92 | 2.93% | 0.79% |
| Last Week | 6 | 12.15 | 5.27% | -3.68% |
| 13 Weeks | 281 | 12.77 | 6.34% |
-10.06% |
2This represents the return if each stock were bought at its breakout price and sold at its intraday high.
3This represents the return if each stock were bought at its breakout price and sold at the most recent close.
Category |
Symbol |
Company Name |
Expected Gain1 |
|---|---|---|---|
| Best Overall | NSU | Nevsun Resources (USA) | 102 |
| Top Technical | TMF | Direxion Daily 30-Yr Trsry Bull 3X Shrs | 42 |
| Top Fundamental | HANS | Hansen Natural Corporation | 40 |
| Top Tech. & Fund. | HANS | Hansen Natural Corporation | 40 |
Category |
Symbol |
Company Name |
Expected Gain1 |
|---|---|---|---|
| Best Overall | RIC | Richmont Mines Inc. (USA) | 83 |
| Top Technical | RLRN | Renaissance Learning, Inc. | 56 |
| Top Fundamental | ITC | ITC Holdings Corp. | 30 |
| Top Tech. & Fund. | RIC | Richmont Mines Inc. (USA) | 83 |
If you received this newsletter from a friend and you would like to receive it regularly please go to the BreakoutWatch.com site and enter as a Guest. You will then be able to register to receive the newsletter.
Copyright © 2011 NBIcharts, LLC dba BreakoutWatch.com.
All rights reserved.
"
BreakoutWatch," the BreakoutWatch.com "eye" logo, and the
slogan "tomorrow's breakouts today" are service marks of NBIcharts
LLC. All other marks are the property of their respective owners, and are
used for descriptive purposes only.
BreakoutWatch is not affiliated with Investor's Business Daily or with Mr. William O'Neil.
Our site, research and analysis is supported entirely by subscription and is free from advertising.