| Market Summary | Weekly Breakout Report | Top Breakout Choices | Top 2nd Chances | New Features | Tip of the Week |
The
New Year is off to a good start with several breakouts making gains of
over 25% already. ACHN (Achillion Pharmaceuticals) has gained over
50%, VOXX (Voxx International) reached a 35% intraday gain over its
breakout price and NQ (NetQin Mobile Inc) jumped 28%.
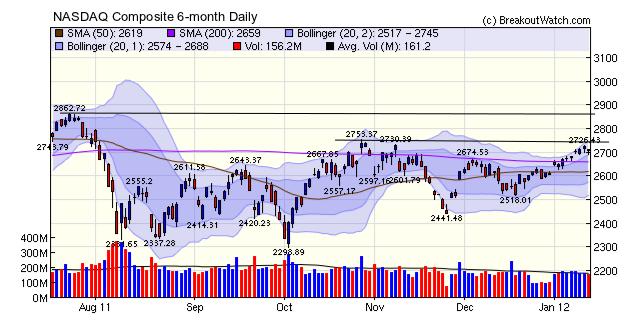
The NASDAQ Composite has been rising steadily but the volume trend is downward so we wonder how long the momentum can be sustained. There are many headwinds facing the economy, as Nouriel Roubini explains here but perhaps the source of optimism driving the markets higher is obtained in this observation by Roubini: "Given the bearish outlook for US economic growth, the Fed can be expected to engage in another round of quantitative easing." QE3 may not help the economy, but it will certainly move stocks higher. If so, the NASDAQ faces resistance almost immediately at less than 1% above its Friday close and then again at 2863.
The NASDAQ Composite has been rising steadily but the volume trend is downward so we wonder how long the momentum can be sustained. There are many headwinds facing the economy, as Nouriel Roubini explains here but perhaps the source of optimism driving the markets higher is obtained in this observation by Roubini: "Given the bearish outlook for US economic growth, the Fed can be expected to engage in another round of quantitative easing." QE3 may not help the economy, but it will certainly move stocks higher. If so, the NASDAQ faces resistance almost immediately at less than 1% above its Friday close and then again at 2863.
The markets closed higher for the second week of the year but with
tensions rising in the Strait of Hormuz, in response to increasing
western pressure on Iran, one wonders how long this can continue. For
now, oil traders are discounting Iran's threats to close the strait as
a bluff they can't carry out because of the damage it would do to its
own economy, and oil futures actually retreated on Friday. But Iran is
not a democracy and has shown it will deal harshly with any internal
rebellion that might occur in response to the economic hardship of its
people. At home the rhetoric is becoming increasingly strident as the
Administration cannot appear to be weak in an election year so a
continued heightening of tension seems inevitable with the "risk
premium" on oil likely to rise.
No new Features this Week
More on the Importance of Volume
In the commentary above we said of the NASDAQ "the volume trend is downward so we wonder how long the momentum can be sustained." So where does this concern about falling volume while prices are rising come from?
In "Technical Analysis of the Financial Markets" John J. Murphy describes it like this: "The level of volume measures the intensity or urgency behind the price move. Heavier volume reflects a higher degree of of intensity or pressure". Or more succinctly "volume should increase or expand in the direction of the existing price trend".
So when we see the price trend rising but the volume level falling, then that indicates that the intensity of support for the existing price trend is waning and hence our concern.
When price rises and volume expands we say that a stock is under "accumulation" and when price declines but volume expands we say that a stock is under "distribution". The concepts of accumulation and distribution are therefore important because they combine measures of price movement and volume. When stocks start to come under accumulation, we want to be a buyer and when they start to come under distribution, we want to be a seller.
We use accumulation and distribution in our proprietary turning point algorithm as confirmation of price trends measured by the stochRSI. You can see these at work in our "Trend Reversal Signals" tool where we show price, smoothed StochRSI and smoothed Acc/Dis together.
This understanding of the importance of volume was originally contained in a series of editorials published in the Wall Street Journal at the turn of the 20'th century written by Charles Dow. These have come to be known as "Dow's Theory".
| Index | Value | Change Week | Change YTD | Trend | ||||||||||||||||||||||||||||||||||||
|---|---|---|---|---|---|---|---|---|---|---|---|---|---|---|---|---|---|---|---|---|---|---|---|---|---|---|---|---|---|---|---|---|---|---|---|---|---|---|---|---|
| Dow | 12422.1 | 0.5% | 1.67% | Down | ||||||||||||||||||||||||||||||||||||
| NASDAQ | 2710.67 | 1.36% | 4.05% | Up | ||||||||||||||||||||||||||||||||||||
| S&P 500 | 1289.09 | 0.88% | 2.5% | Down | ||||||||||||||||||||||||||||||||||||
| Russell 2000 | 764.2 | 1.93% | 3.14% | Up | ||||||||||||||||||||||||||||||||||||
1The Market Signal is derived from our proprietary
market model. The market model is described on the site. 2The site also shows industry rankings based on fundamentals, combined technical and fundamentals, and on price alone. The site also shows daily industry movements. |
||||||||||||||||||||||||||||||||||||||||
# of Breakouts |
Period Average1 |
Max. Gain During Period2 |
Gain at Period Close3 |
|
|---|---|---|---|---|
| This Week | 23 | 24.69 | 9.2% | 5.65% |
| Last Week | 26 | 22.85 | 7.17% | 4.52% |
| 13 Weeks | 321 | 24.85 | 10.86% |
4.22% |
2This represents the return if each stock were bought at its breakout price and sold at its intraday high.
3This represents the return if each stock were bought at its breakout price and sold at the most recent close.
Category |
Symbol |
Company Name |
Expected Gain1 |
|---|---|---|---|
| Best Overall | PDFS | 105 | |
| Top Technical | MBI | MBIA Inc. | 61 |
| Top Fundamental | RAX | Rackspace Hosting, Inc. | 41 |
| Top Tech. & Fund. | RAX | Rackspace Hosting, Inc. | 41 |
Category |
Symbol |
Company Name |
Expected Gain1 |
|---|---|---|---|
| Best Overall | CELL | 76 | |
| Top Technical | RGR | Sturm, Ruger & Company | 56 |
| Top Fundamental | CELG | Celgene Corporation | 26 |
| Top Tech. & Fund. | CELG | Celgene Corporation | 26 |
If you received this newsletter from a friend and you would like to receive it regularly please go to the BreakoutWatch.com site and enter as a Guest. You will then be able to register to receive the newsletter.
Copyright © 2012 NBIcharts, LLC dba BreakoutWatch.com.
All rights reserved.
"
BreakoutWatch," the BreakoutWatch.com "eye" logo, and the
slogan "tomorrow's breakouts today" are service marks of NBIcharts
LLC. All other marks are the property of their respective owners, and are
used for descriptive purposes only.
BreakoutWatch is not affiliated with Investor's Business Daily or with Mr. William O'Neil.
Our site, research and analysis is supported entirely by subscription and is free from advertising.