| Market Summary | Weekly Breakout Report | Top Breakout Choices | Top 2nd Chances | New Features | Tip of the Week |
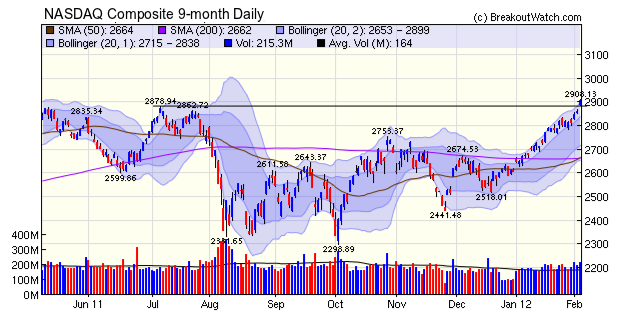
The NASDAQ Composite gapped up Friday morning on the strong employment report numbers and broke through resistance at 2879. The rally gained strength through the day and closed up 1.6%. Volume was 30% above the 50 day average showing that the rally had strong support. This week's price action was strong and deserves several comments.
- Friday was the third accumulation day for the index this week indicating there is now strong buying interest.
- The nine month chart shows the index is now just outside the 2-standard deviation Bollinger Band. This does not mean that a retrenchment is imminent, but it does mean that upward moves are likely to be less dramatic than we saw in the last four days. A feature of Bollinger Bands is that they widen or contract as price momentum waxes and wanes, so the 2-sd band can track the price move further upwards. It is price that moves the bands, rather than the bands controlling the price!
- Average daily volume, which was weakening from last October through to the start of the year is now trending
up. You can see from the chart that since the start of the year,
volumes have been mostly higher than the 50 day average.
- Jan Payroll gains show big upside surprise of 243k, about 100k more than expected, unemployment rate falls to 8.3%
- 2) ISM services index rises to best since Feb ’11
- 3) ISM mfr’g up 1 pt but touch less than expected
- 4) Jan vehicle sales at 14.1mm is best since clunker month in Aug ’09 and the most since May ’08 before that
- 5) US savings rate rises to 4% from 3.5%
| B'out Date | Symbol | Base | Last Close | Current % off BOP |
Gain at
Intraday High |
|---|---|---|---|---|---|
| 1/30/2012 | TNB | CwH | 71.4 | 21.04% | 21.21% |
| 2/1/2012 | PMFG | CwH | 27.3 | 20.37% | 20.81% |
| 1/30/2012 | UBNT | CwH | 25 | 9.60% | 19.38% |
| 2/3/2012 | CTCT | CwH | 30.22 | 9.22% | 16.30% |
| 1/31/2012 | SAVE | CwH | 19.21 | 14.76% | 15.59% |
| 2/2/2012 | CNQR | CwH | 57.42 | 5.38% | 14.88% |
| 2/1/2012 | MKSI | CwH | 32.17 | 4.65% | 13.83% |
| 2/2/2012 | GSVC | CwH | 20.45 | 10.84% | 12.36% |
| 1/30/2012 | NBIX | CwH | 9.48 | 6.28% | 11.88% |
| 1/30/2012 | ABD | CwH | 11.01 | 8.79% | 10.28% |
| 2/1/2012 | OLP | CwH | 18.89 | 6.90% | 10.02% |
No new features this week.
Writing computer algorithms to recognize chart patterns is fundamental to what we do at breakoutwatch. In fact, writing computer algorithms for stock analysis, transportation analysis and econometrics has been one of many joys of my life, so I am naturally very interested in how algorithms increasingly control how markets move. But algorithms don't just control the stock market, they increasingly control many aspects of our lives and getting an edge in their design and execution is becoming paramount, and expensive. You might find this talk at TED interesting, I did. How algorithms shape our world .
| Index | Value | Change Week | Change YTD | Trend | ||||||||||||||||||||||||||||||||||||
|---|---|---|---|---|---|---|---|---|---|---|---|---|---|---|---|---|---|---|---|---|---|---|---|---|---|---|---|---|---|---|---|---|---|---|---|---|---|---|---|---|
| Dow | 12862.2 | 1.59% | 5.28% | Down | ||||||||||||||||||||||||||||||||||||
| NASDAQ | 2905.66 | 3.16% | 11.54% | Up | ||||||||||||||||||||||||||||||||||||
| S&P 500 | 1344.9 | 2.17% | 6.94% | Down | ||||||||||||||||||||||||||||||||||||
| Russell 2000 | 831.11 | 4.04% | 12.17% | Down | ||||||||||||||||||||||||||||||||||||
1The Market Signal is derived from our proprietary
market model. The market model is described on the site. 2The site also shows industry rankings based on fundamentals, combined technical and fundamentals, and on price alone. The site also shows daily industry movements. |
||||||||||||||||||||||||||||||||||||||||
# of Breakouts |
Period Average1 |
Max. Gain During Period2 |
Gain at Period Close3 |
|
|---|---|---|---|---|
| This Week | 79 | 24.38 | 6.12% | 4.37% |
| Last Week | 34 | 20.69 | 6.72% | 4.69% |
| 13 Weeks | 331 | 26.54 | 11.45% |
8.08% |
2This represents the return if each stock were bought at its breakout price and sold at its intraday high.
3This represents the return if each stock were bought at its breakout price and sold at the most recent close.
Category |
Symbol |
Company Name |
Expected Gain1 |
|---|---|---|---|
| Best Overall | NQ | NetQin Mobile Inc (ADR) | 113 |
| Top Technical | DMAN | DemandTec, Inc. | 40 |
| Top Fundamental | ECHO | 66 | |
| Top Tech. & Fund. | ECHO | 66 |
Category |
Symbol |
Company Name |
Expected Gain1 |
|---|---|---|---|
| Best Overall | CALD | Callidus Software Inc. | 94 |
| Top Technical | WRLS | Telular Corporation | 74 |
| Top Fundamental | TDG | TransDigm Group Incorporated | 0 |
| Top Tech. & Fund. | TDG | TransDigm Group Incorporated | 0 |
If you received this newsletter from a friend and you would like to receive it regularly please go to the BreakoutWatch.com site and enter as a Guest. You will then be able to register to receive the newsletter.
Copyright © 2012 NBIcharts, LLC dba BreakoutWatch.com.
All rights reserved.
"
BreakoutWatch," the BreakoutWatch.com "eye" logo, and the
slogan "tomorrow's breakouts today" are service marks of NBIcharts
LLC. All other marks are the property of their respective owners, and are
used for descriptive purposes only.
BreakoutWatch is not affiliated with Investor's Business Daily or with Mr. William O'Neil.
Our site, research and analysis is supported entirely by subscription and is free from advertising.