| Market Summary | Weekly Breakout Report | Top Breakout Choices | Top 2nd Chances | New Features | Tip of the Week |
The
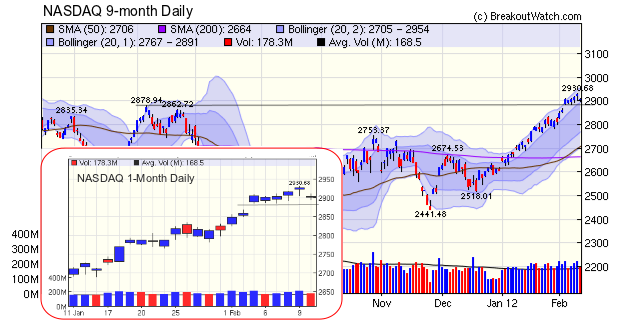
NASDAQ Composite broke through resistance last Friday and as you can
see from the inset chart, that level has now become support. (We
examine the reasons for resistance and support levels in this week's
tip below.) The support level was tested on Monday and Tuesday this
week and looks as though it will be tested again. If the index falls
through support then the 2880 level will again become resistance.
In the very short term, the vote in the Greek parliament this weekend will affect stock prices on Monday, but even if the vote supports the latest proposed austerity measures, it is unlikely to satisfy Germany, who have already said that the proposal is insufficient, so uncertainty will continue. The austerity measures throughout Europe are threatening another recession which cannot be good for the US economy either.
In the very short term, the vote in the Greek parliament this weekend will affect stock prices on Monday, but even if the vote supports the latest proposed austerity measures, it is unlikely to satisfy Germany, who have already said that the proposal is insufficient, so uncertainty will continue. The austerity measures throughout Europe are threatening another recession which cannot be good for the US economy either.
No new features this week.
Why Resistance Becomes Support and Vice Versa
Looking at the inset chart we see that volumes were above the 50 day average in the four days prior to the index breaking through resistance last Friday. Those buyers will be satisfied with their purchases and will look to add to their positions. The heavy volume suggests that there are quite a few of them. Those that didn't buy into the market may be wishing they had and will be looking for a buying opportunity.
This opportunity presents itself as some traders take profits and prices fall to the support level, at which point buyers enter the market who believe in "buy the dip". Prices now rise again and short term traders again take profits, leading to another buying opportunity. You can see that this scenario played out on the first three days of this week. The tails on the candlesticks show where the lows of the day were, which was the point where buyers entered the market. If the index falls to the 28880 level again we may see another replay.
As prices start to fall to the support level the number of sellers, possibly swelled by short sellers, my increase to the point where sellers overwhelm those who are buying the dip and support will be broken. As prices fall through the support level then the scenario reverses. As prices fall, there will be those that hold on but will look for an opportunity to cut their losses. This opportunity will present itself when sufficient traders think that prices are now undervalued and enter the market as buyers. As the prices rise, the former support level will be seen as a selling opportunity and so it now becomes a resistance.
| Index | Value | Change Week | Change YTD | Trend | ||||||||||||||||||||||||||||||||||||
|---|---|---|---|---|---|---|---|---|---|---|---|---|---|---|---|---|---|---|---|---|---|---|---|---|---|---|---|---|---|---|---|---|---|---|---|---|---|---|---|---|
| Dow | 12801.2 | -0.47% | 4.78% | Down | ||||||||||||||||||||||||||||||||||||
| NASDAQ | 2903.88 | -0.06% | 11.47% | Up | ||||||||||||||||||||||||||||||||||||
| S&P 500 | 1342.64 | -0.17% | 6.76% | Down | ||||||||||||||||||||||||||||||||||||
| Russell 2000 | 813.33 | -2.14% | 9.77% | Down | ||||||||||||||||||||||||||||||||||||
1The Market Signal is derived from our proprietary
market model. The market model is described on the site. 2The site also shows industry rankings based on fundamentals, combined technical and fundamentals, and on price alone. The site also shows daily industry movements. |
||||||||||||||||||||||||||||||||||||||||
# of Breakouts |
Period Average1 |
Max. Gain During Period2 |
Gain at Period Close3 |
|
|---|---|---|---|---|
| This Week | 16 | 24.85 | 5.57% | -0.6% |
| Last Week | 82 | 24.38 | 7.61% | 2.38% |
| 13 Weeks | 331 | 26.15 | 12.06% |
5.88% |
2This represents the return if each stock were bought at its breakout price and sold at its intraday high.
3This represents the return if each stock were bought at its breakout price and sold at the most recent close.
Category |
Symbol |
Company Name |
Expected Gain1 |
|---|---|---|---|
| Best Overall | FLML | Flamel Technologies S.A. (ADR) | 127 |
| Top Technical | SOA | Solutia Inc. | 67 |
| Top Fundamental | GOLD | Randgold Resources Ltd. (ADR) | 39 |
| Top Tech. & Fund. | ECHO | Echo Global Logistics, Inc. |
64 |
Category |
Symbol |
Company Name |
Expected Gain1 |
|---|---|---|---|
| Best Overall | AKRX | Akorn, Inc. | 84 |
| Top Technical | NWL | Newell Rubbermaid Inc. | 55 |
| Top Fundamental | AKRX | Akorn, Inc. | 84 |
| Top Tech. & Fund. | AKRX | Akorn, Inc. | 84 |
If you received this newsletter from a friend and you would like to receive it regularly please go to the BreakoutWatch.com site and enter as a Guest. You will then be able to register to receive the newsletter.
Copyright © 2012 NBIcharts, LLC dba BreakoutWatch.com.
All rights reserved.
"
BreakoutWatch," the BreakoutWatch.com "eye" logo, and the
slogan "tomorrow's breakouts today" are service marks of NBIcharts
LLC. All other marks are the property of their respective owners, and are
used for descriptive purposes only.
BreakoutWatch is not affiliated with Investor's Business Daily or with Mr. William O'Neil.
Our site, research and analysis is supported entirely by subscription and is free from advertising.