| Market Summary | Weekly Breakout Report | Top Breakout Choices | Top 2nd Chances | New Features | Tip of the Week |
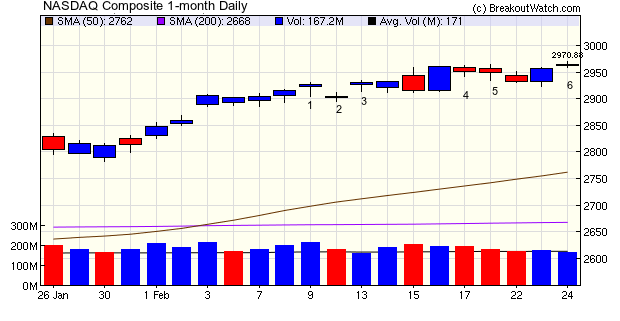
This week we look at the candlestick chart pattern for the NASDAQ Composite for the last month. The chart is characterized by a large number of 'doji' candlesticks, 6 in the last 11 sessions. Doji patterns occur when the bulls and bears are almost in balance and indicate uncertainty about the future direction of the market. This uncertainty is hardly surprising considering the length and strength of the current rally and domestic and geopolitical considerations. The index has gained almost 18% since its short term bottom on December 19 and the rate of increase has started to flatten as traders question how long the rally can last. Pushing the index higher though is the improving domestic economy, which is sure to produce more investment in technology as industry replaces aging equipment, but this is offset by increasing concern over rising oil prices and the potential for major supply reductions if the cold war with Iran turns hotter. On balance, the bulls are winning even if only by a little (see Friday's result) and the trend remains to move higher.
We have replaced our standard chart display with our newer technical analysis display. This was always available from a link from the standard charts but it is now the default display.
Now, when you enter a symbol into the BoWChart box in the page header you will automatically receive the T/A chart format. This is true for all the other chart links that used the old format as well.
Candlestick Chart Patterns
Why do we prefer candlestick charts to the more common open, high, low, close charts? The answer is that although both chart styles convey the same information, we find the candlestick chart more visually appealing. To our eye, the candlestic chart gives a more quickly understood representation of the day's price action. We also apply the use of color to illustrate a higher (blue) or lower (red) close, whereas teh traditional ohlc chart is a monotone black.
The origin of candlestick chart patterns goes back to Chinese rice trading in the 17th century and you can read an excellent summary of the major patterns at this Introduction to Candlestick Charts.
| Index | Value | Change Week | Change YTD | Trend | ||||||||||||||||||||||||||||||||||||
|---|---|---|---|---|---|---|---|---|---|---|---|---|---|---|---|---|---|---|---|---|---|---|---|---|---|---|---|---|---|---|---|---|---|---|---|---|---|---|---|---|
| Dow | 12983 | 0.26% | 6.26% | Down | ||||||||||||||||||||||||||||||||||||
| NASDAQ | 2963.75 | 0.41% | 13.77% | Up | ||||||||||||||||||||||||||||||||||||
| S&P 500 | 1365.74 | 0.33% | 8.6% | Up | ||||||||||||||||||||||||||||||||||||
| Russell 2000 | 826.92 | -0.21% | 11.61% | Down | ||||||||||||||||||||||||||||||||||||
1The Market Signal is derived from our proprietary
market model. The market model is described on the site. 2The site also shows industry rankings based on fundamentals, combined technical and fundamentals, and on price alone. The site also shows daily industry movements. |
||||||||||||||||||||||||||||||||||||||||
# of Breakouts |
Period Average1 |
Max. Gain During Period2 |
Gain at Period Close3 |
|
|---|---|---|---|---|
| This Week | 20 | 27 | 5.72% | 4.01% |
| Last Week | 37 | 26.38 | 6.39% | 2.03% |
| 13 Weeks | 362 | 27.85 | 12.91% |
6.66% |
2This represents the return if each stock were bought at its breakout price and sold at its intraday high.
3This represents the return if each stock were bought at its breakout price and sold at the most recent close.
Category |
Symbol |
Company Name |
Expected Gain1 |
|---|---|---|---|
| Best Overall | IDSY | I.D. Systems, Inc. | 120 |
| Top Technical | MNTX | Manitex International, Inc. | 108 |
| Top Fundamental | GOLD | Randgold Resources Ltd. (ADR) |
0 |
| Top Tech. & Fund. | GOLD | Randgold Resources Ltd. (ADR) |
0 |
Category |
Symbol |
Company Name |
Expected Gain1 |
|---|---|---|---|
| Best Overall | FSM | Fortuna Silver Mines Inc Ordinary Shares (Canada)& | 117 |
| Top Technical | MPWR | Monolithic Power Systems, Inc. | 65 |
| Top Fundamental | TAL | TAL International Group, Inc. |
48 |
| Top Tech. & Fund. | TAL | TAL International Group, Inc. |
48 |
If you received this newsletter from a friend and you would like to receive it regularly please go to the BreakoutWatch.com site and enter as a Guest. You will then be able to register to receive the newsletter.
Copyright © 2012 NBIcharts, LLC dba BreakoutWatch.com.
All rights reserved.
"
BreakoutWatch," the BreakoutWatch.com "eye" logo, and the
slogan "tomorrow's breakouts today" are service marks of NBIcharts
LLC. All other marks are the property of their respective owners, and are
used for descriptive purposes only.
BreakoutWatch is not affiliated with Investor's Business Daily or with Mr. William O'Neil.
Our site, research and analysis is supported entirely by subscription and is free from advertising.