| Market Summary | Weekly Breakout Report | Top Breakout Choices | Top 2nd Chances | New Features | Tip of the Week |
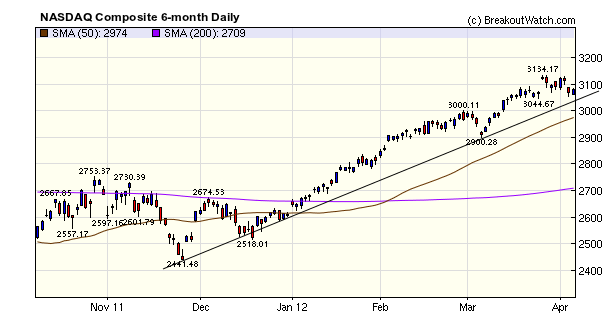
The NASDAQ Composite gave up 0.4% this week but still fared much better than the other major indexes. Regular readers know we have been expecting a period of consolidation and losses so far have been well contained, despite four distribution days in the last seven sessions. We still consider a target of 3200 to be likely before a major correction occurs but the index could test support at 3050 in the near term.
No new features this week.
Performance of 'Second Chance' Breakouts - Part 1
Each week I publish the top 'second chance' stocks, being those stocks that broke out during the week, that rate highly by technical and fundamental criteria but have pulled back below their breakout price on the Friday before newsletter publication.
Following my offer last week to undertake backtesting of subscribers' suggested strategies, I was asked to look at the performance of these "second chances" on the assumption that they are bought at the open of the next session.
This isn't exactly possible because I don't record the symbols published as second chances each week. Instead, I've looked at all second chances defined by those stocks that broke out since 2007 and were below their breakout price at the end of the week in which they broke out. This includes all second chances, not just those with a high technical and/or fundamental score.
The analysis assumes buying each second chance at the open of the next (usually Monday) session and then looking at the percentage gain until the close at the end of the next four weeks.
The results for all second chances are hardly encouraging. The chart below shows the percentage gain of the stocks at the end of weeks 1, 2, 3 and 4 of stocks grouped in 5% ranges from -25% to greater than +25%. For example, the chart shows that after 1 week, 9% of stocks had gained between 0 and 5% and 3.7% had gained between 5 and 10%.
Overall, after 1 week, just 54.4% of stocks were in the black. After 2 weeks, the number in the black fell to 52.2% and by week 4 only 50.8% were in the black.
We can conclude from this that buying all (or a random selection) of second chances is not a good strategy. Next week, we'll look at how being more selective by buying only more highly ranked second chances works out.

| Index | Value | Change Week | Change YTD | Trend | ||||||||||||||||||||||||||||||||||||
|---|---|---|---|---|---|---|---|---|---|---|---|---|---|---|---|---|---|---|---|---|---|---|---|---|---|---|---|---|---|---|---|---|---|---|---|---|---|---|---|---|
| Dow | 13060.1 | -1.15% | 6.9% | Down | ||||||||||||||||||||||||||||||||||||
| NASDAQ | 3080.5 | -0.36% | 18.25% | Up | ||||||||||||||||||||||||||||||||||||
| S&P 500 | 1398.08 | -0.74% | 11.17% | Down | ||||||||||||||||||||||||||||||||||||
| Russell 2000 | 818.18 | -1.46% | 10.43% | Down | ||||||||||||||||||||||||||||||||||||
1The Market Signal is derived from our proprietary
market model. The market model is described on the site. 2The site also shows industry rankings based on fundamentals, combined technical and fundamentals, and on price alone. The site also shows daily industry movements. |
||||||||||||||||||||||||||||||||||||||||
# of Breakouts |
Period Average1 |
Max. Gain During Period2 |
Gain at Period Close3 |
|
|---|---|---|---|---|
| This Week | 11 | 26 | 4.65% | 1.37% |
| Last Week | 15 | 26.62 | 4.65% | -1.42% |
| 13 Weeks | 288 | 27.69 | 12.34% |
3.92% |
2This represents the return if each stock were bought at its breakout price and sold at its intraday high.
3This represents the return if each stock were bought at its breakout price and sold at the most recent close.
Category |
Symbol |
Company Name |
Expected Gain1 |
|---|---|---|---|
| Best Overall | NCT | Newcastle Investment Corp. | 110 |
| Top Technical | NCT | Newcastle Investment Corp. | 110 |
| Top Fundamental | FTK | Flotek Industries, Inc. | 72 |
| Top Tech. & Fund. | FTK | Flotek Industries, Inc. | 72 |
Category |
Symbol |
Company Name |
Expected Gain1 |
|---|---|---|---|
| Best Overall | BIOS | BioScrip Inc. | 99 |
| Top Technical | TK | Teekay Corporation | 34 |
| Top Fundamental | GPI | Group 1 Automotive, Inc. | 43 |
| Top Tech. & Fund. | GPI | Group 1 Automotive, Inc. | 43 |
If you received this newsletter from a friend and you would like to receive it regularly please go to the BreakoutWatch.com site and enter as a Guest. You will then be able to register to receive the newsletter.
Copyright © 2012 NBIcharts, LLC dba BreakoutWatch.com.
All rights reserved.
"
BreakoutWatch," the BreakoutWatch.com "eye" logo, and the
slogan "tomorrow's breakouts today" are service marks of NBIcharts
LLC. All other marks are the property of their respective owners, and are
used for descriptive purposes only.
BreakoutWatch is not affiliated with Investor's Business Daily or with Mr. William O'Neil.
Our site, research and analysis is supported entirely by subscription and is free from advertising.