| Market Summary | Weekly Breakout Report | Top Breakout Choices | Top 2nd Chances | New Features | Tip of the Week |
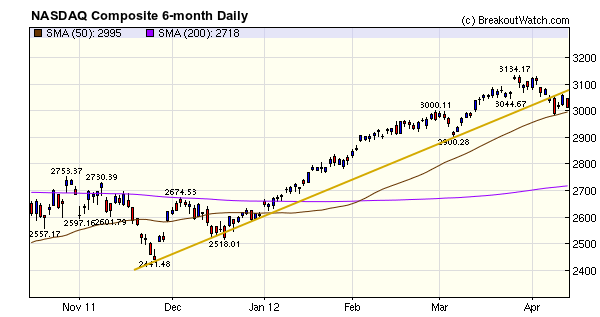
The NASDAQ Composite fell through the medium term support line (orange) on Monday but found support at the 50 day moving average level on Tuesday. The orange line is now resistance and breakout above it would signal the end of the current correction. Adversely, a breakdown below the 50 day average would indicate a possible move down to 2900, the previous support level.

Our market trend for NASDAQ and small cap stocks continues to point upwards but until the current short term correction is resolved, patience is advised.
No new Features this week.
Performance
of 'Second Chance' Breakouts - Part 2
Last week, at the request of a
subscriber we analyzed the performance of 'second chance' breakouts
after 1, 2, 3 and 4 weeks. You will recall that I defined 'second
chances' as those stocks that broke out since 2007 and had pulled
back below their breakout price at the end of the week in which they
broke out. The objective was to analyze the performance of these stocks
if they were bought at the open on the following Monday (or next
session).
The performance of these stocks
was poor: after 1 week, just 54.4% of stocks were in the black. After 2
weeks, the number in the black fell to 52.2% and by week 4 only 50.8%
were in the black.
However, this was the performance
for all breakouts and this week we look at those second chances that
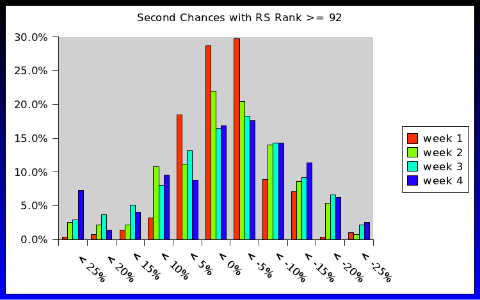
had a Relative Strength Rank (RS) >= 92 (our favored filter). Chart
1 shows the percentage gain of these stocks at the end of weeks 1, 2,
3 and 4 grouped in 5% ranges from -25% to greater than +25%.
For example, the chart shows that after 1 week, 30% of stocks were
still below their BoP in the range 0 -to -5%, while 29% were between 0
and +5%. This table shows the percentage of stocks that were positive
versus those that were negative after 1- 4 weeks.
| Second
Chances with RS Rank >= 92 |
||
| |
Winners | Losers |
| Week 1 | 52.8% | 47.2% |
| Week 2 | 50.7% | 49.3% |
| Week 3 | 49.5% | 50.5% |
| Week 4 | 48.0% | 52.0% |

Chart 1
We conclude, as before, that
second chances do not make attractive investments when sold on the 1,2,3 or 4 week anniversary of purchase.
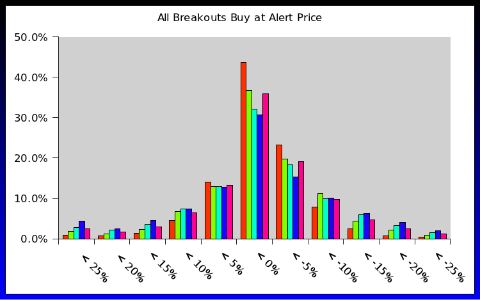
For comparison purposes, lets apply the same kind of analysis to all breakouts if they were bought at the alert price. We find that stocks that have a positive gain outnumber the losers by almost 2:1.

Conclusion
So called 'second chances' have liitle value as investment vehicles when bought on the Monday following a week in which they closed below their breakout price and were then sold after exactly 1, 2, 3 or 4 weeks.
For comparison, if you can buy on alert, and close to the alert price, you have a 2:1 chance that your position will net you a profit in the next 4 weeks.
If you buy at the next day's open, then your chances of having a winning stock fall to 5:4.
Important Note: this analysis was done at the request of a subscriber and is not representative of how we suggest you use our data. The analysis covers the period 1/1/2007 to now, and includes one of the most severe bear markets in history and also a strong bull. These results are therefore not typical of what you might achieve if you used additional criteria, such as our market signals, to determine when to open or close a position. The analysis also assumes selling after fixed periods of 1, 2, 3 and 4 weeks which is an unlikely trading strategy.
For comparison purposes, lets apply the same kind of analysis to all breakouts if they were bought at the alert price. We find that stocks that have a positive gain outnumber the losers by almost 2:1.
| Buy
on Alert performance |
||
| |
Winners | Losers |
| Week 1 | 65.3% | 34.7% |
| Week 2 | 61.8% | 38.2% |
| Week 3 | 61.0% | 39.0% |
| Week 4 | 62.2% | 37.8% |

Chart 2
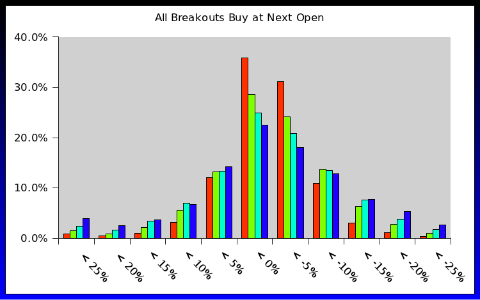
Again, for comparison purposes, lets apply the same analysis to all breakouts if you buy at the next open.
Tables

Chart 3
| |||||||||||||||||||

Chart 3
Conclusion
So called 'second chances' have liitle value as investment vehicles when bought on the Monday following a week in which they closed below their breakout price and were then sold after exactly 1, 2, 3 or 4 weeks.
For comparison, if you can buy on alert, and close to the alert price, you have a 2:1 chance that your position will net you a profit in the next 4 weeks.
If you buy at the next day's open, then your chances of having a winning stock fall to 5:4.
Important Note: this analysis was done at the request of a subscriber and is not representative of how we suggest you use our data. The analysis covers the period 1/1/2007 to now, and includes one of the most severe bear markets in history and also a strong bull. These results are therefore not typical of what you might achieve if you used additional criteria, such as our market signals, to determine when to open or close a position. The analysis also assumes selling after fixed periods of 1, 2, 3 and 4 weeks which is an unlikely trading strategy.
| Index | Value | Change Week | Change YTD | Trend | ||||||||||||||||||||||||||||||||||||
|---|---|---|---|---|---|---|---|---|---|---|---|---|---|---|---|---|---|---|---|---|---|---|---|---|---|---|---|---|---|---|---|---|---|---|---|---|---|---|---|---|
| Dow | 12849.6 | 5.17% | 5.17% | Down | ||||||||||||||||||||||||||||||||||||
| NASDAQ | 3011.33 | 15.59% | 15.59% | Up | ||||||||||||||||||||||||||||||||||||
| S&P 500 | 1370.26 | 8.96% | 8.96% | Down | ||||||||||||||||||||||||||||||||||||
| Russell 2000 | 796.29 | 7.47% | 7.47% | Up | ||||||||||||||||||||||||||||||||||||
1The Market Signal is derived
from our proprietary market model. The market model is described on the
site.
2The site also shows industry rankings based on fundamentals, combined technical and fundamentals, and on price alone. The site also shows daily industry movements. |
||||||||||||||||||||||||||||||||||||||||
|
# of Breakouts
|
Period Average1
|
Max. Gain During Period2
|
Gain at Period Close3
|
|
|---|---|---|---|---|
| This Week | 8 | 24.38 | 117.71% | -3.38% |
| Last Week | 13 | 26 | 4.75% | -0.52% |
| 13 Weeks | 251 | 26.38 | 20.08% |
-0.04% |
2This represents the return if each stock were bought at its breakout price and sold at its intraday high.
3This represents the return if each stock were bought at its breakout price and sold at the most recent close.
|
Category
|
Symbol
|
Company Name
|
Expected Gain1
|
|---|---|---|---|
| Best Overall | ARAY | Accuray Incorporated | 99 |
| Top Technical | ARAY | Accuray Incorporated | 99 |
| Top Fundamental | HF | HFF, Inc. | 62 |
| Top Tech. & Fund. | HF | HFF, Inc. | 62 |
|
Category
|
Symbol
|
Company Name
|
Expected Gain1
|
|---|---|---|---|
| Best Overall | BTA | BlackRock LT Municipal Advantage Trust | 65 |
| Top Technical | HGIC | Harleysville Group Inc. | 28 |
| Top Fundamental | AMSF | Amerisafe, Inc. | 58 |
| Top Tech. & Fund. | AMSF | Amerisafe, Inc. | 58 |
If you received this newsletter from a friend and you would like to receive it regularly please go to the BreakoutWatch.com site and enter as a Guest. You will then be able to register to receive the newsletter.
Copyright © 2012 NBIcharts, LLC dba BreakoutWatch.com. All
rights reserved.
" BreakoutWatch," the BreakoutWatch.com "eye" logo, and the slogan
"tomorrow's breakouts today" are service marks of NBIcharts LLC. All
other marks are the property of their respective owners, and are used
for descriptive purposes only.
BreakoutWatch is not affiliated with Investor's Business Daily
or with Mr. William O'Neil.
Our site, research and analysis is supported entirely by subscription
and is free from advertising.