| Market Summary | Weekly Breakout Report | Top Breakout Choices | Top 2nd Chances | New Features | Tip of the Week |
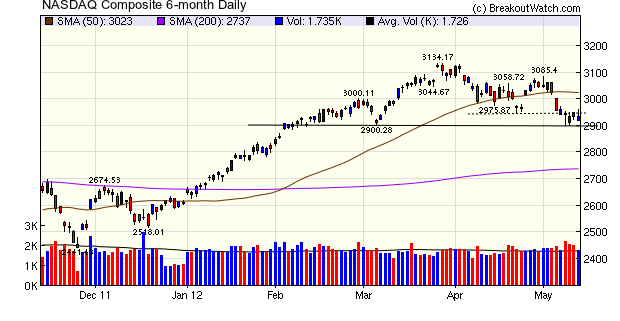
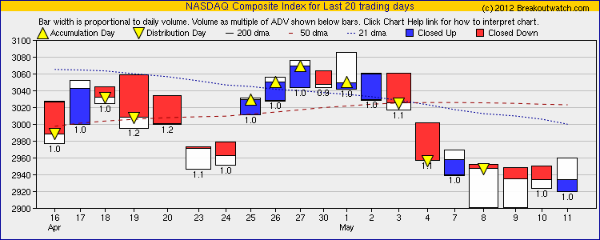
The NASDAQ failed to find support at 2950 (dotted line) as we had hoped last week, but did find a floor at 2900 (solid line) on Tuesday giving a strong intraday reversal (see equivolume chart). 2900 was tested again on Wednesday and also produced an intraday reversal. Friday's close, ever so slightly above the level of mid-week, confirms that 2900 is the bottom of the trading range, at least for now.
Our trend indicator for the NASDAQ remains positive, although it is the only major index to do so following a trend reversal by the S&P 500 on Monday. While the domestic economy remains weak the markets will continue to be buffeted by political turmoil in Europe and the contraction of European and Asian economies.
The number of breakouts was in
line with the 13 week average despite the generally negative tone and
they succeeded in closing in the black on average, easily beating the
major averages.
No new features this week.
This feature will retrun next week.
| Index | Value | Change Week | Change YTD | Trend | ||||||||||||||||||||||||||||||||||||
|---|---|---|---|---|---|---|---|---|---|---|---|---|---|---|---|---|---|---|---|---|---|---|---|---|---|---|---|---|---|---|---|---|---|---|---|---|---|---|---|---|
| Dow | 12820.6 | -1.67% | 4.94% | Down | ||||||||||||||||||||||||||||||||||||
| NASDAQ | 2933.82 | -0.76% | 12.62% | Up | ||||||||||||||||||||||||||||||||||||
| S&P 500 | 1353.39 | -1.15% | 7.62% | Down | ||||||||||||||||||||||||||||||||||||
| Russell 2000 | 790.06 | -0.22% | 6.63% | Down | ||||||||||||||||||||||||||||||||||||
1The Market Signal is derived from our proprietary
market model. The market model is described on the site. 2The site also shows industry rankings based on fundamentals, combined technical and fundamentals, and on price alone. The site also shows daily industry movements. |
||||||||||||||||||||||||||||||||||||||||
# of Breakouts |
Period Average1 |
Max. Gain During Period2 |
Gain at Period Close3 |
|
|---|---|---|---|---|
| This Week | 16 | 17.23 | 2.81% | 0.75% |
| Last Week | 18 | 17.77 | 4.14% | -2.12% |
| 13 Weeks | 276 | 19 | 9.64% |
-1.76% |
2This represents the return if each stock were bought at its breakout price and sold at its intraday high.
3This represents the return if each stock were bought at its breakout price and sold at the most recent close.
Category |
Symbol |
Company Name |
Expected Gain1 |
|---|---|---|---|
| Best Overall | TRR | TRC Companies, Inc |
109 |
| Top Technical | TRR | TRC Companies, Inc |
109 |
| Top Fundamental | SLXP | Salix Pharmaceuticals, Ltd. | 32 |
| Top Tech. & Fund. | SLXP | Salix Pharmaceuticals, Ltd. | 32 |
Category |
Symbol |
Company Name |
Expected Gain1 |
|---|---|---|---|
| Best Overall | DCIX | Diana Containerships Inc | 90 |
| Top Technical | XBI | SPDR S&P Biotech (ETF) | 26 |
| Top Fundamental | TRAK | DealerTrack Holdings, Inc. | 56 |
| Top Tech. & Fund. | TRAK | DealerTrack Holdings, Inc. | 56 |
If you received this newsletter from a friend and you would like to receive it regularly please go to the BreakoutWatch.com site and enter as a Guest. You will then be able to register to receive the newsletter.
Copyright © 2012 NBIcharts, LLC dba BreakoutWatch.com.
All rights reserved.
"
BreakoutWatch," the BreakoutWatch.com "eye" logo, and the
slogan "tomorrow's breakouts today" are service marks of NBIcharts
LLC. All other marks are the property of their respective owners, and are
used for descriptive purposes only.
BreakoutWatch is not affiliated with Investor's Business Daily or with Mr. William O'Neil.
Our site, research and analysis is supported entirely by subscription and is free from advertising.