| Market Summary | Weekly Breakout Report | Top Breakout Choices | Top 2nd Chances | New Features | Tip of the Week |
The NASDAQ Composite is testing its 200 day moving average support level. Unless there is some reassuring announcement over the weekend, Monday could be 'black'.
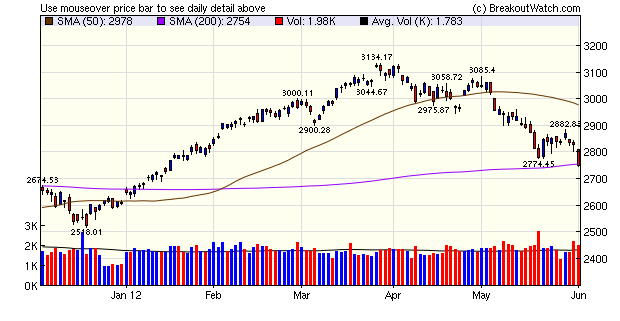
Our market signals for the DJI and
S&P 500 turned positive on Tuesday as our algorithm detected a
bottom reversal. Due to the lag inherent in any trend reversal
recognition algorithm, the trend signal has not yet reversed although it will
very likely do so on Monday unless there is an (unlikely) significant
bounce.
We have had difficulty getting reliable data, particularly volume, for the Russell 2000 futures charts and have therefore dropped the Russell 2000 from our daily and weekly analysis charts.
I had hoped to publish a new analysis suggested by a subscriber in this newsletter but was unable to get it completed in time. The analysis proposed was to buy MTC stocks on breakout if they were above both their 8 and 21 day exponential moving average, and the NASADQ was in an uptrend, and to sell when the 8 day ema turned down.
We should be able to complete that by next week.
| Index | Value | Change Week | Change YTD | Trend | ||||||||||||||||||||||||||||||||||||
|---|---|---|---|---|---|---|---|---|---|---|---|---|---|---|---|---|---|---|---|---|---|---|---|---|---|---|---|---|---|---|---|---|---|---|---|---|---|---|---|---|
| Dow | 12118.6 | -2.7% | -0.81% | Up | ||||||||||||||||||||||||||||||||||||
| NASDAQ | 2747.48 | -3.17% | 5.46% | Down | ||||||||||||||||||||||||||||||||||||
| S&P 500 | 1278.04 | -3.02% | 1.63% | Up | ||||||||||||||||||||||||||||||||||||
1The Market Signal is derived from our proprietary
market model. The market model is described on the site. 2The site also shows industry rankings based on fundamentals, combined technical and fundamentals, and on price alone. The site also shows daily industry movements. |
||||||||||||||||||||||||||||||||||||||||
# of Breakouts |
Period Average1 |
Max. Gain During Period2 |
Gain at Period Close3 |
|
|---|---|---|---|---|
| This Week | 9 | 12.69 | 4.66% | 1.88% |
| Last Week | 10 | 13.92 | 2.99% | -1.39% |
| 13 Weeks | 209 | 14.46 | 6.8% |
-7.09% |
2This represents the return if each stock were bought at its breakout price and sold at its intraday high.
3This represents the return if each stock were bought at its breakout price and sold at the most recent close.
Category |
Symbol |
Company Name |
Expected Gain1 |
|---|---|---|---|
| Best Overall | ABR | Arbor Realty Trust, Inc. | 100 |
| Top Technical | ABR | Arbor Realty Trust, Inc. | 100 |
| Top Fundamental | LOPE | Grand Canyon Education Inc | 55 |
| Top Tech. & Fund. | LOPE | Grand Canyon Education Inc | 55 |
Category |
Symbol |
Company Name |
Expected Gain1 |
|---|---|---|---|
| Best Overall | DAL | Delta Air Lines, Inc. | 61 |
| Top Technical | DAL | Delta Air Lines, Inc. | 61 |
| Top Fundamental | DAL | Delta Air Lines, Inc. | 61 |
| Top Tech. & Fund. | DAL | Delta Air Lines, Inc. | 61 |
If you received this newsletter from a friend and you would like to receive it regularly please go to the BreakoutWatch.com site and enter as a Guest. You will then be able to register to receive the newsletter.
Copyright © 2012 NBIcharts, LLC dba BreakoutWatch.com.
All rights reserved.
"
BreakoutWatch," the BreakoutWatch.com "eye" logo, and the
slogan "tomorrow's breakouts today" are service marks of NBIcharts
LLC. All other marks are the property of their respective owners, and are
used for descriptive purposes only.
BreakoutWatch is not affiliated with Investor's Business Daily or with Mr. William O'Neil.
Our site, research and analysis is supported entirely by subscription and is free from advertising.