| Market Summary | Weekly Breakout Report | Top Breakout Choices | Top 2nd Chances | New Features | Tip of the Week |
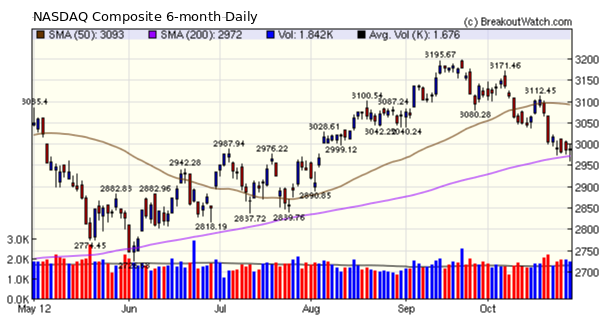
Our DJI trend indicator turned negative on Monday joining the NASDAQ and S&P 500 indicators as company earnings continued to disappoint. We anticipated last week that the NASDAQ could find support at the 200 dma level and that proved true on Friday as the Commerce Department reported a slightly higher than expected GDP number for the third quarter. While this GDP report may provide reasons for optimism, Barry Ritholz is not so sure. We agree as the fiscal cliff still threatens and continued inaction by our leaders will almost certainly result in a new recession next year.
We continue to advise caution until at least our NASDAQ trend indicator turns upwards.
Facebook App
We started work on this last year. Many things intervened to delay progress but it is at least ready for release. The app is available for free and can be accessed at https://apps.facebook.com/todaysbreakouts/
Please click our 'like' button.
This feature will return next week.
| Index | Value | Change Week | Change YTD | Trend | ||||||||||||||||||||||||||||||||||||
|---|---|---|---|---|---|---|---|---|---|---|---|---|---|---|---|---|---|---|---|---|---|---|---|---|---|---|---|---|---|---|---|---|---|---|---|---|---|---|---|---|
| Dow | 13107.2 | -1.77% | 7.28% | Down | ||||||||||||||||||||||||||||||||||||
| NASDAQ | 2987.95 | -0.59% | 14.69% | Down | ||||||||||||||||||||||||||||||||||||
| S&P 500 | 1411.94 | -1.48% | 12.27% | Down | ||||||||||||||||||||||||||||||||||||
1The Market Signal is derived
from our proprietary market model. The market model is described on the
site.
2The site also shows industry rankings based on fundamentals, combined technical and fundamentals, and on price alone. The site also shows daily industry movements. |
||||||||||||||||||||||||||||||||||||||||
|
# of Breakouts
|
Period Average1
|
Max. Gain During Period2
|
Gain at Period Close3
|
|
|---|---|---|---|---|
| This Week | 15 | 19 | 2.92% | 2.27% |
| Last Week | 18 | 19.38 | 1.19% | -2.89% |
| 13 Weeks | 291 | 20.54 | 8.62% |
0.99% |
2This represents the return if each stock were bought at its breakout price and sold at its intraday high.
3This represents the return if each stock were bought at its breakout price and sold at the most recent close.
|
Category
|
Symbol
|
Company Name
|
Expected Gain1
|
|---|---|---|---|
| Best Overall | ADY | Feihe International Inc | 110 |
| Top Technical | ADY | Feihe International Inc | 110 |
| Top Fundamental | CAP | CAI International Inc | 47 |
| Top Tech. & Fund. | CAP | CAI International Inc | 47 |
|
Category
|
Symbol
|
Company Name
|
Expected Gain1
|
|---|---|---|---|
| Best Overall | KEP | Korea Electric Power Corporation (ADR) | 63 |
| Top Technical | HNP | Huaneng Power International, Inc. (ADR) | 45 |
| Top Fundamental | TMO | Thermo Fisher Scientific Inc. | 29 |
| Top Tech. & Fund. | MPEL | Melco Crown Entertainment Ltd (ADR) | 57 |
If you received this newsletter from a friend and you would like to receive it regularly please go to the BreakoutWatch.com site and enter as a Guest. You will then be able to register to receive the newsletter.
Copyright © 2012 NBIcharts, LLC dba BreakoutWatch.com. All
rights reserved.
" BreakoutWatch," the BreakoutWatch.com "eye" logo, and the slogan
"tomorrow's breakouts today" are service marks of NBIcharts LLC. All
other marks are the property of their respective owners, and are used
for descriptive purposes only.
BreakoutWatch is not affiliated with Investor's Business Daily
or with Mr. William O'Neil.
Our site, research and analysis is supported entirely by subscription
and is free from advertising.