| Market Summary | Weekly Breakout Report | Top Breakout Choices | Top 2nd Chances | New Features | Tip of the Week |
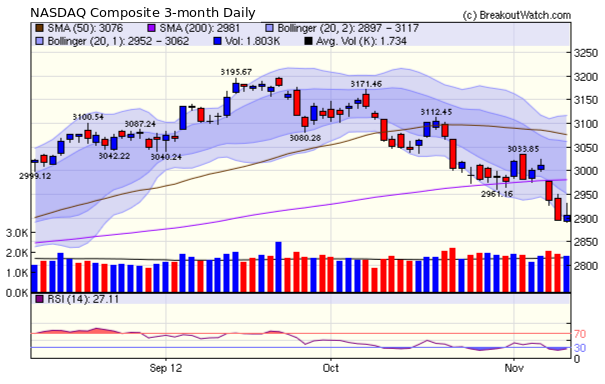
The markets went over the cliff on Wednesday but found a floor on Friday as political leaders promised to work together to find a solution before sequestration sends the economy into recession. The NASDAQ chart shows that fear of the 'fiscal cliff' and further slowing of the European economy, caused the index to crash through the 200 day moving average which had been providing support until Wednesday.
Before Wednesday's dive, our trend indicators had all turned positive as it appeared the major indexes had found a bottom. There is always several days delay before the indicators can confirm a new trend so their current 'up' status should be ignored until we get further information. To help asses the true situation, for this week's chart I've added the one and two standard deviation Bollinger Bands and the RSI momentum oscillator. Both indicators show that the index is oversold. Note that the RSI is already turning up and it is also unusual for the index to stay outside the two standard deviation BB for long. I think these factors make it likely, although not certain, that we will move up from here.
New CwH Backtest Option
At the request of a subscriber, I've added an additional parameter to the cup-with-handle backtest tool. The new option allows you to test selling at the next day's open if a certain volume to 50 day average volume(ADV) ratio is not met by the close. This allows you to test a scenario where you buy on alert at, say, 1.5 times ADV and then sell at the next open if the volume did not meet, say, 2.5 times ADV.
I discuss the advantages of this in this week's tip.
Optimum Hold Time and Best Volume to ADV Ratio
The same subscriber asked "Can you run a test that would show the optimal parameters of how long to stay in a trade and at what level you would set the percent gain?".
To test how long to stay in a trade, I ran the backtest for 1 year and 5 years using:
Number of Positions: 4;
Buy Rule: Buy on Breakout Alert at 1.5 times volume
Sell if Unconfirmed: no
Stop Loss: 6 %
Trailing Stop: 6 %
Target Gain: 100 %
Use Market Trend: yes
Minimum RS Rank: 92
Minimum BoP: $6
Minimum ADV: 100k
Over 12 months, the optimum hold period was 30 days with an overall return of 63.6% with an average of 13.9% per trade.
Over 5 years, the optimum hold period was also 30 days with an overall return of 239% with average of 10.9% per trade.
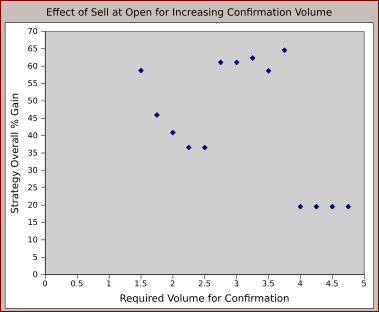
Using that optimum hold period, I then tested the effect of selling at the next open if certain breakout volumes were not met, using the new confirmation volume option, over the last 12 months. The results are charted in this graph (backtest settings were as above):
As
you can see, if you wish to sell at open if a minimum volume is not met
by the close on breakout day, then a minimum confirmation volume
of greater than 2.75 times ADV is desirable and 3.75 times ADV is
optimal with a total return of 64.6%. Higher values are very suboptimal.
Note though, that this strategy is only marginally better (64.6% cf. 63.6%) than buying on alert at 1.5 times ADV and holding rather than selling at the next open.
Note though, that this strategy is only marginally better (64.6% cf. 63.6%) than buying on alert at 1.5 times ADV and holding rather than selling at the next open.
| Index | Value | Change Week | Change YTD | Trend | ||||||||||||||||||||||||||||||||||||
|---|---|---|---|---|---|---|---|---|---|---|---|---|---|---|---|---|---|---|---|---|---|---|---|---|---|---|---|---|---|---|---|---|---|---|---|---|---|---|---|---|
| Dow | 12815.4 | -2.12% | 4.89% | Up | ||||||||||||||||||||||||||||||||||||
| NASDAQ | 2904.87 | -2.59% | 11.5% | Up | ||||||||||||||||||||||||||||||||||||
| S&P 500 | 1379.85 | -2.43% | 9.72% | Up | ||||||||||||||||||||||||||||||||||||
1The Market Signal is derived from our proprietary
market model. The market model is described on the site. 2The site also shows industry rankings based on fundamentals, combined technical and fundamentals, and on price alone. The site also shows daily industry movements. |
||||||||||||||||||||||||||||||||||||||||
# of Breakouts |
Period Average1 |
Max. Gain During Period2 |
Gain at Period Close3 |
|
|---|---|---|---|---|
| This Week | 13 | 20.31 | 3.15% | 1.26% |
| Last Week | 28 | 20 | 4.69% | 0.32% |
| 13 Weeks | 328 | 21 | 7.78% |
-1.55% |
2This represents the return if each stock were bought at its breakout price and sold at its intraday high.
3This represents the return if each stock were bought at its breakout price and sold at the most recent close.
Category |
Symbol |
Company Name |
Expected Gain1 |
|---|---|---|---|
| Best Overall | SKH | Skilled Healthcare Group, Inc. | 100 |
| Top Technical | SKH | Skilled Healthcare Group, Inc. | 100 |
| Top Fundamental | WOR | Worthington Industries, Inc. | 46 |
| Top Tech. & Fund. | CHS | Chico's FAS, Inc. | 49 |
Category |
Symbol |
Company Name |
Expected Gain1 |
|---|---|---|---|
| Best Overall | OMX | OfficeMax Incorporated | 81 |
| Top Technical | TPCG | TPC Group Inc | 34 |
| Top Fundamental | LCC | US Airways Group, Inc. | 67 |
| Top Tech. & Fund. | HOLI | Hollysys Automation Technologies Ltd | 69 |
If you received this newsletter from a friend and you would like to receive it regularly please go to the BreakoutWatch.com site and enter as a Guest. You will then be able to register to receive the newsletter.
Copyright © 2012 NBIcharts, LLC dba BreakoutWatch.com.
All rights reserved.
"
BreakoutWatch," the BreakoutWatch.com "eye" logo, and the
slogan "tomorrow's breakouts today" are service marks of NBIcharts
LLC. All other marks are the property of their respective owners, and are
used for descriptive purposes only.
BreakoutWatch is not affiliated with Investor's Business Daily or with Mr. William O'Neil.
Our site, research and analysis is supported entirely by subscription and is free from advertising.