| Market Summary | Weekly Breakout Report | Top Breakout Choices | Top 2nd Chances | New Features | Tip of the Week |
All our trend indicators are now pointing up. Nevertheless, Friday's action, where the markets spent much of the day in the red, show that market action is likely to be somewhat volatile until the 'fiscal cliff' debate is resolved.
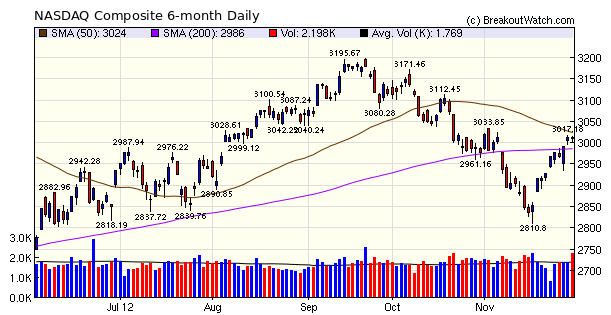
The NASDAQ Composite has overcome resistance at the 200 dma level and now faces the 50 dma level.
The number of successful breakouts increased but was below the 13 week average. The average gains until Friday's close was above the weekly gain for the NASDAQ index showing our breakouts generally outperformed the broader market.
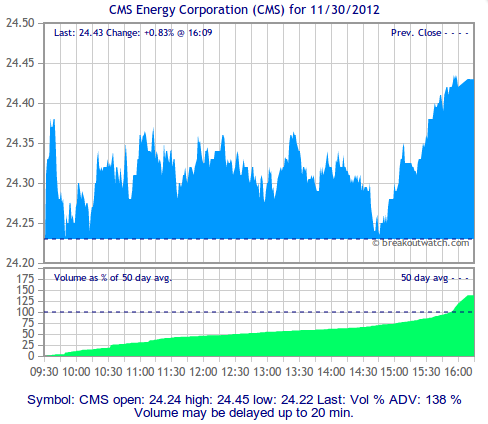
Following a request from a subscriber, we have added intraday volume to our intraday charts for stocks listed on our watchlists. We have also extended the availability of the monitor outside market hours. Note however that the status indicators may not be reliable as subsequent system updates may have affected calculations.
Here is an example from Friday's alert monitor taken after the market has closed. The chart includes data received until 15 minutes after the close to include and late trade and/or volume information.
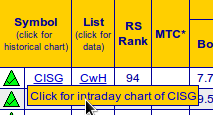
Getting the intraday chart can be a little tricky.
1. Go to the Take Action - Alerts > Alert Monitor menu choice
2. As you roll your mouse over the symbols, a drop down will appear containing the link to the intraday chart.
1. Go to the Take Action - Alerts > Alert Monitor menu choice
2. As you roll your mouse over the symbols, a drop down will appear containing the link to the intraday chart.
Work on the new market trend indicators was delayed while we implemented the Alert Monitor changes. This will definitely be released next week.
| Index | Value | Change Week | Change YTD | Trend | ||||||||||||||||||||||||||||||||||||
|---|---|---|---|---|---|---|---|---|---|---|---|---|---|---|---|---|---|---|---|---|---|---|---|---|---|---|---|---|---|---|---|---|---|---|---|---|---|---|---|---|
| Dow | 13025.6 | 0.12% | 6.61% | Up | ||||||||||||||||||||||||||||||||||||
| NASDAQ | 3010.24 | 1.46% | 15.55% | Up | ||||||||||||||||||||||||||||||||||||
| S&P 500 | 1416.18 | 0.5% | 12.61% | Up | ||||||||||||||||||||||||||||||||||||
1The Market Signal is derived from our proprietary
market model. The market model is described on the site. 2The site also shows industry rankings based on fundamentals, combined technical and fundamentals, and on price alone. The site also shows daily industry movements. |
||||||||||||||||||||||||||||||||||||||||
# of Breakouts |
Period Average1 |
Max. Gain During Period2 |
Gain at Period Close3 |
|
|---|---|---|---|---|
| This Week | 17 | 20.08 | 3.1% | 1.94% |
| Last Week | 14 | 19.92 | 4.99% | 3.25% |
| 13 Weeks | 342 | 21.23 | 5.73% |
-0.83% |
2This represents the return if each stock were bought at its breakout price and sold at its intraday high.
3This represents the return if each stock were bought at its breakout price and sold at the most recent close.
Category |
Symbol |
Company Name |
Expected Gain1 |
|---|---|---|---|
| Best Overall | POWR | PowerSecure International, Inc. | 101 |
| Top Technical | POWR | PowerSecure International, Inc. | 101 |
| Top Fundamental | FHCO | The Female Health Company | 93 |
| Top Tech. & Fund. | FHCO | The Female Health Company | 93 |
Category |
Symbol |
Company Name |
Expected Gain1 |
|---|---|---|---|
| Best Overall | GNMK | GenMark Diagnostics, Inc | 89 |
| Top Technical | GNMK | GenMark Diagnostics, Inc | 89 |
| Top Fundamental | SWHC | Smith & Wesson Holding Corporation | 82 |
| Top Tech. & Fund. | SWHC | Smith & Wesson Holding Corporation | 82 |
If you received this newsletter from a friend and you would like to receive it regularly please go to the BreakoutWatch.com site and enter as a Guest. You will then be able to register to receive the newsletter.
Copyright © 2012 NBIcharts, LLC dba BreakoutWatch.com.
All rights reserved.
"
BreakoutWatch," the BreakoutWatch.com "eye" logo, and the
slogan "tomorrow's breakouts today" are service marks of NBIcharts
LLC. All other marks are the property of their respective owners, and are
used for descriptive purposes only.
BreakoutWatch is not affiliated with Investor's Business Daily or with Mr. William O'Neil.
Our site, research and analysis is supported entirely by subscription and is free from advertising.