| Market Summary | Weekly Breakout Report | Top Breakout Choices | Top 2nd Chances | New Features | Tip of the Week |
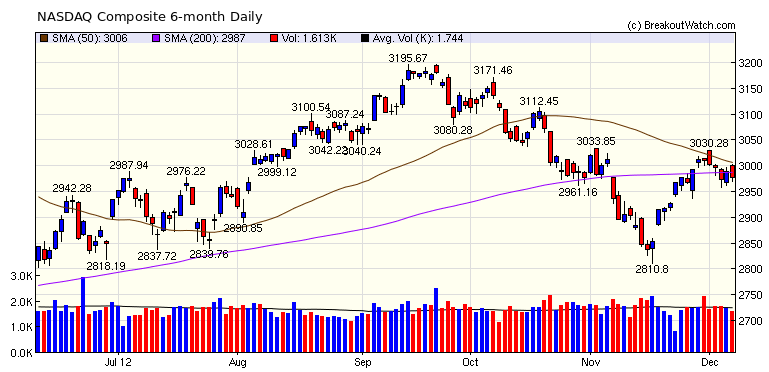
The NASDAQ composite is hitting resistance at the 50 day level. If this continues we will soon see the 50 day average cross below the 200 day average which will be a bearish signal. For now, our market trend indicator continues to say the trend is up, but the indicator is just an imperfect guide, not an oracle (more below). The markets seem to be watching the 'fiscal cliff' negotiations but Barry Ritholz believes this is not all that is going on and the uncertain direction can also be explained by weak corporate profits, adjustment to an over bought condition, failed market expectations of a Romney victory. Read his comments here.
Fiscal cliff or fiscal slope or not, the markets may also be factoring in the very real prospect of a recession in 2013 because even if the cliff/slope is avoided, public sector (Federal and State) expenditure will be reduced in 2013. The ECRI believes we are already in recession. see The Tell Tale Chart
You will see in our tables below that breakouts were few this week and rarely profitable. I suggest a great deal of caution despite our optimistic trend indicator..
You may have noticed that the
newsletter is being posted later recently. This is because while we are
in Australia we are almost a day ahead of East Coast time. The
result is that the Friday market close actually happens on Saturday for
us and weekend family commitments often mean I don't get to work on the
newsletter until our Monday, Sunday for you.
The Zack's watchlist daily refresh is now functioning again after a brief hiccup
For the past three weeks we have reported that we are working on fine tuning our market trend indicators. We initially thought we had succeeded in making a substantial improvement when looking at recent market trends but when we did sensitivity testing over longer time frames, and with different starting and ending dates, we did not find a statistically significant improvement, so our current trend indicators will remain in place.
We are always looking to improve our algorithms and we may find a better solution in the future.
| Index | Value | Change Week | Change YTD | Trend | ||||||||||||||||||||||||||||||||||||
|---|---|---|---|---|---|---|---|---|---|---|---|---|---|---|---|---|---|---|---|---|---|---|---|---|---|---|---|---|---|---|---|---|---|---|---|---|---|---|---|---|
| Dow | 13155.1 | 0.99% | 7.67% | Up | ||||||||||||||||||||||||||||||||||||
| NASDAQ | 2978.04 | -1.07% | 14.31% | Up | ||||||||||||||||||||||||||||||||||||
| S&P 500 | 1418.07 | 0.13% | 12.76% | Up | ||||||||||||||||||||||||||||||||||||
1The Market Signal is derived from our proprietary
market model. The market model is described on the site. 2The site also shows industry rankings based on fundamentals, combined technical and fundamentals, and on price alone. The site also shows daily industry movements. |
||||||||||||||||||||||||||||||||||||||||
# of Breakouts |
Period Average1 |
Max. Gain During Period2 |
Gain at Period Close3 |
|
|---|---|---|---|---|
| This Week | 6 | 17.62 | 0.8% | -0.68% |
| Last Week | 20 | 20.08 | 3.57% | 0.12% |
| 13 Weeks | 309 | 20.54 | 5.54% |
-1.43% |
2This represents the return if each stock were bought at its breakout price and sold at its intraday high.
3This represents the return if each stock were bought at its breakout price and sold at the most recent close.
Category |
Symbol |
Company Name |
Expected Gain1 |
|---|---|---|---|
| Best Overall | RGEN | Repligen Corporation | 104 |
| Top Technical | RGEN | Repligen Corporation | 104 |
| Top Fundamental | PRXL | PAREXEL International Corporation | 37 |
| Top Tech. & Fund. | RAX | Rackspace Hosting, Inc. | 33 |
Category |
Symbol |
Company Name |
Expected Gain1 |
|---|---|---|---|
| Best Overall | DSW | DSW Inc. | 42 |
| Top Technical | THD | iShares MSCI Thailand Index Fund | 11 |
| Top Fundamental | ABAX | Abaxis Inc | 33 |
| Top Tech. & Fund. | ABAX | Abaxis Inc | 33 |
If you received this newsletter from a friend and you would like to receive it regularly please go to the BreakoutWatch.com site and enter as a Guest. You will then be able to register to receive the newsletter.
Copyright © 2012 NBIcharts, LLC dba BreakoutWatch.com.
All rights reserved.
"
BreakoutWatch," the BreakoutWatch.com "eye" logo, and the
slogan "tomorrow's breakouts today" are service marks of NBIcharts
LLC. All other marks are the property of their respective owners, and are
used for descriptive purposes only.
BreakoutWatch is not affiliated with Investor's Business Daily or with Mr. William O'Neil.
Our site, research and analysis is supported entirely by subscription and is free from advertising.