| Market Summary | Weekly Breakout Report | Top Breakout Choices | Top 2nd Chances | New Features | Tip of the Week |
Special
Offer
We need testimonials for
a site promotion effort. Tell me in 50 words or less
why you like the site and I'll extend your
subscription by a week. I won't use your name, only
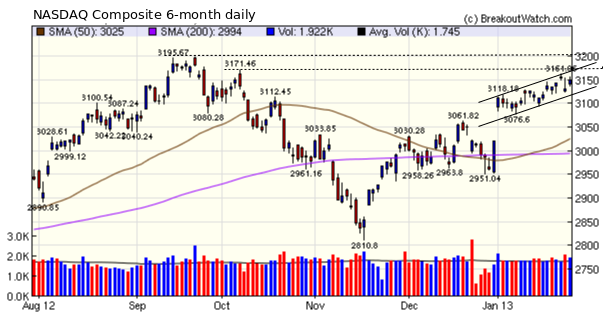
your initials and city, state.The NASDAQ Composite continues to move up and approaches its recent highs. The index is outpacing the other major indexes with a gain of 6% in less than a month. Resistance lies ahead, but with the Fed maintaining its cheap money policy as long as employment remains depressed, it is likely that the upward trend will continue, although it is doubtful that the current pace can be maintained so a pause is likely. This could happen once the first resistance level is overcome. That level then becomes support so we may see the index in a trading range bounded by the dotted lines on the chart as the upper resistance level is tested.
EPS Trends
We introduce a new tool this week which will assist you in your fundamental analysis. The tool captures the changes in analysts assessments of EPS for the current quarter over the last 90 days. While the most recent assessment is the most important, the 90 day trend is also a valuable indicator of changing perceptions.
The tool is currently free and available to all newsletter readers as well as subscribers. Subscribers can access the tool from the Evaluate > Analytical Tools > EPS Trends menu. Newsletter readers can access it by clicking this image:
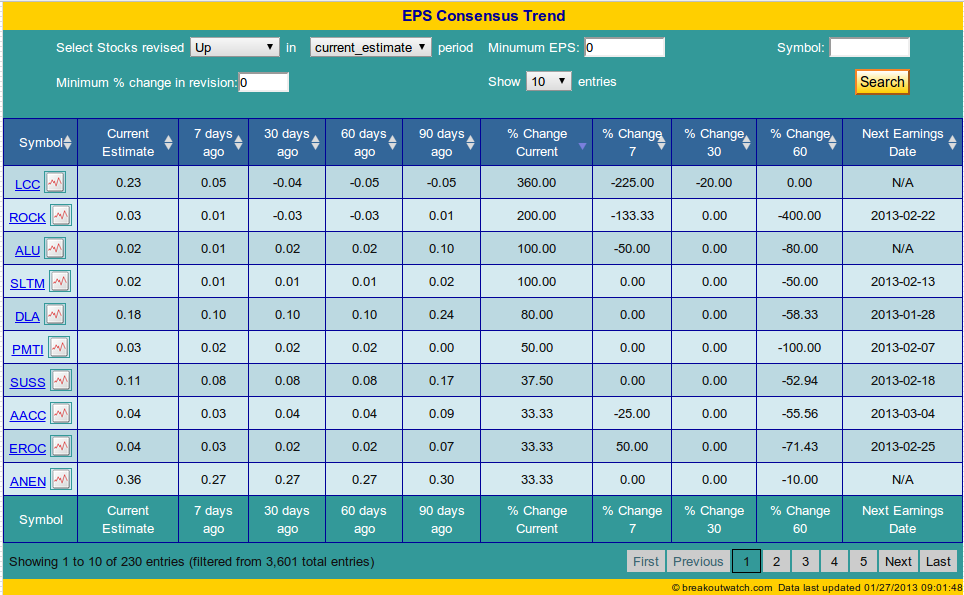
You will see that the tool allows you to filter for specific EPS revisions . Clicking a symbol will bring up the CANTATA Evaluator and clicking the chart icon brings up a candlestick chart.
Stocks are first listed in descending order of current earnings upward revision. Clicking a column heading will sort the data after doing a new data extraction. So for example, click the current estimate up arrow and you will get stocks with the highest earnings expectation. We expect to develop this tool more extensively in future and link it with our watchlists.
We introduce a new tool this week which will assist you in your fundamental analysis. The tool captures the changes in analysts assessments of EPS for the current quarter over the last 90 days. While the most recent assessment is the most important, the 90 day trend is also a valuable indicator of changing perceptions.
The tool is currently free and available to all newsletter readers as well as subscribers. Subscribers can access the tool from the Evaluate > Analytical Tools > EPS Trends menu. Newsletter readers can access it by clicking this image:
You will see that the tool allows you to filter for specific EPS revisions . Clicking a symbol will bring up the CANTATA Evaluator and clicking the chart icon brings up a candlestick chart.
Stocks are first listed in descending order of current earnings upward revision. Clicking a column heading will sort the data after doing a new data extraction. So for example, click the current estimate up arrow and you will get stocks with the highest earnings expectation. We expect to develop this tool more extensively in future and link it with our watchlists.
I was intending to present results of a screen that would look for the optimum filter settings over the last six months. These types of simulations can be lengthy and its been running for 8 hours and hasn't yet finished.
I will present the results next week.
Meanwhile, enjoy the new EPS trends tool.
| Index | Value | Change Week | Change YTD | Trend | ||||||||||||||||||||||||||||||||||||
|---|---|---|---|---|---|---|---|---|---|---|---|---|---|---|---|---|---|---|---|---|---|---|---|---|---|---|---|---|---|---|---|---|---|---|---|---|---|---|---|---|
| Dow | 13896 | 1.8% | 6.04% | Up | ||||||||||||||||||||||||||||||||||||
| NASDAQ | 3149.71 | 0.48% | 4.31% | Up | ||||||||||||||||||||||||||||||||||||
| S&P 500 | 1502.96 | 1.14% | 5.38% | Up | ||||||||||||||||||||||||||||||||||||
1The Market Signal is
derived from our proprietary market model. The
market model is described on the site.
2The site also shows industry rankings based on fundamentals, combined technical and fundamentals, and on price alone. The site also shows daily industry movements. |
||||||||||||||||||||||||||||||||||||||||
|
# of Breakouts
|
Period Average1
|
Max. Gain During Period2
|
Gain at Period Close3
|
|
|---|---|---|---|---|
| This Week | 18 | 20.15 | 3.38% | 3.23% |
| Last Week | 22 | 19.92 | 8.42% | 5.89% |
| 13 Weeks | 312 | 21.31 | 10.35% |
7.44% |
2This represents the return if each stock were bought at its breakout price and sold at its intraday high.
3This represents the return if each stock were bought at its breakout price and sold at the most recent close.
|
Category
|
Symbol
|
Company Name
|
Expected Gain1
|
|---|---|---|---|
| Best Overall | RGEN | Repligen Corporation | 96 |
| Top Technical | RGEN | Repligen Corporation | 96 |
| Top Fundamental | OCN | Ocwen Financial Corporation | 42 |
| Top Tech. & Fund. | OCN | Ocwen Financial Corporation | 42 |
|
Category
|
Symbol
|
Company Name
|
Expected Gain1
|
|---|---|---|---|
| Best Overall | RF | Regions Financial Corporation | 78 |
| Top Technical | GOL | Gol Linhas Aereas Inteligentes SA (ADR) | 74 |
| Top Fundamental | LL | Lumber Liquidators Holdings Inc | 42 |
| Top Tech. & Fund. | LL | Lumber Liquidators Holdings Inc | 42 |
If you received this newsletter from a friend and you would like to receive it regularly please go to the BreakoutWatch.com site and enter as a Guest. You will then be able to register to receive the newsletter.
Copyright © 2013 NBIcharts, LLC dba
BreakoutWatch.com. All rights reserved.
" BreakoutWatch," the BreakoutWatch.com "eye" logo, and
the slogan "tomorrow's breakouts today" are service marks
of NBIcharts LLC. All other marks are the property of
their respective owners, and are used for descriptive
purposes only.
BreakoutWatch is not affiliated with Investor's Business
Daily or with Mr. William O'Neil.
Our site, research and analysis is supported entirely by
subscription and is free from advertising.