| Market Summary | Weekly Breakout Report | Top Breakout Choices | Top 2nd Chances | New Features | Tip of the Week |
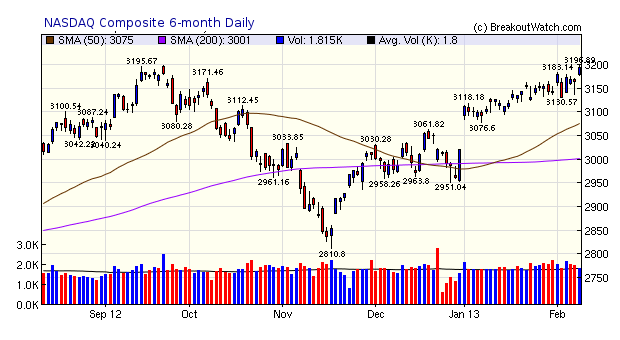
The NASDAQ Composite outperformed the other major indexes this week. The index tested resistance on Friday at its September high but fell back to close 2 points lower. I continue to expect the index to trade in a range between 3170 and 3196 unless sequestration is modified or delayed, or that the market thinks it will be. I have also taken note of John Mauldin's comment in his Outside the Box commentary this week:
"I am neither a market timer nor the son of a market timer, but I know a lot of these guys. And many whom I pay attention to are flashing major warning signals this week. If I were long this market, I would lay in hedges on what I did not want to sell and put in tight stops on the rest. Maybe a correction will be a rest stop on the way to higher numbers. Short term, emotions can drive markets to what, in retrospect a few years later, seems an obvious extreme, either to the upside or downside."
The number of confirmed breakouts fell to almost half the recent weekly average but still delivered a healthy 3.4% average gain by Friday's close.
EPS Current Estimate
The benefits of our EPS trend tool are now part of our watchlists displays with the estimate for the current quarter now being displayed for each symbol on our watchlists.
To make way for this, we removed the MTC column which we no longer recommend as a useful indicator.
Also, the EPS current estimate can now be filtered for and alerts can be selected by this filter also.
At this time, we can't give any guidance as to what, if any, filter value should be used for EPS as we have no history of performance after breakout of stocks with this metric.
CwH Backtest Tool
We added a "slippage" field to the CwH backtest tool. Currently, the breakout price is used as the buy price when the 'Buy on Alert' scenario is run. If used, the slippage value is added to the breakout price to represent a more realistic buy price. The slippage price is expressed in cents. So, for example, if a slippage value of 50 is used, the buy price will be Bop + 0.50.
Recommended Buy Criteria
We ran a simulation of the CwH Backtest tool to seek the most profitable buy criteria this year using the Buy on Alert strategy. We will run the simulation for the Buy at Open strategy next week.
The simulation was done for 4 positions (meaning that 1/4 of available cash was used for each buy) using all combinations of criteria in the following ranges:
- BoP Stop Loss %: 5 to 10 in 1% increments
- Trailing Stop: 2 to 8 in 1% increments
- Min. Vol. to Adv Ratio %: 1.25 to 2 in 0.25% increments
- Confirmation Vol. Ratio %: 1.25 to 2.5 in 0.25% increments
- Top Industry percentile: 25 to 50 in 1 percentile increments
After ranking all the results by Gain/Loss %, the winning values were:
- BoP Stop Loss %: 5%
- Trailing Stop: 7%
- Min. Vol. to Adv Ratio %: 1.25
- Confirmation Vol. Ratio %: 1.25
- Top Industry percentile: 25
You can replicate these results yourself, using the
values described above. However, there are a couple of
caveats to point out about these results:
- These values gave a return since January 1, of 4.53%. Better than the S&P's 3.8% but less than the NASDAQ's 6.8%. This disappointing result is due to using the 4 position option. Because less capital is applied to each position, if we are not fully invested then our capital is not being fully utilized. In fact, the maximum simultaneous positions filled was three and our average capital utilization was only 11.7%. Contrast that with a 1 position strategy, which gave a 16% return (although we were still only fully invested 21% of the time.
- Note the low average volume requirements. This is surely due to the strongly rising market since January 1. The strength of the breakout apparently didn't matter as all breakouts did well.
In view of our skepticism that the trend since January
can continue, we do not recommend these value for your
buy/sell criteria. Instead, we have run the same
simulations going back to the market bottom of June 1,
2012 which includes two uptrends and one steep downturn.
This should provide a more reliable outcome for a
turbulent market.
- BoP Stop Loss %: 5%
- Trailing Stop: 7%
- Min. Vol. to Adv Ratio %: 1.25
- Confirmation Vol. Ratio %: 2
- Top Industry percentile: 40
These values are now the defaults in the CwH backtest
tool.
The 4 position strategy since June 1, 2012 provided an
46% gain. During that period two breakouts contributed
outstanding gains: OCN bought at 16.83 on 7/2012 gained
100% and was sold due to the target gain 100%
limit (it would have gained 113% before being sold on a
trailing stop) and TS gained 45%.
Using these parameters with a 1 position portfolio
returned 66.6%.
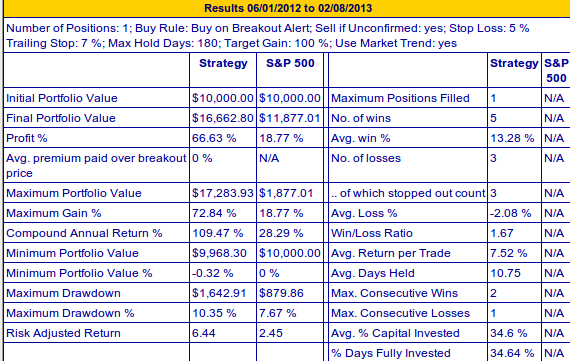
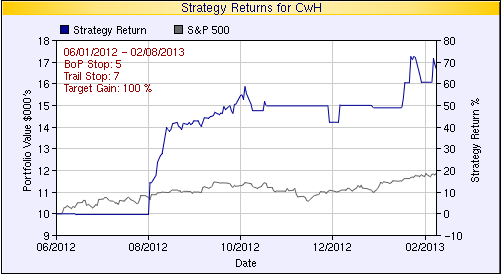
These results were obtained by optimizing the selection criteria over historical data. While the period of the backtest was representative of recent market conditions, the exact sequence of trades represented will never be repeated and so future results using these criteria, could be better or worse.
| Index | Value | Change Week | Change YTD | Trend | ||||||||||||||||||||||||||||||||||||
|---|---|---|---|---|---|---|---|---|---|---|---|---|---|---|---|---|---|---|---|---|---|---|---|---|---|---|---|---|---|---|---|---|---|---|---|---|---|---|---|---|
| Dow | 13993 | -0.12% | 6.78% | Up | ||||||||||||||||||||||||||||||||||||
| NASDAQ | 3193.87 | 0.46% | 5.77% | Up | ||||||||||||||||||||||||||||||||||||
| S&P 500 | 1517.93 | 0.31% | 6.43% | Up | ||||||||||||||||||||||||||||||||||||
1The Market Signal is
derived from our proprietary market model. The
market model is described on the site.
2The site also shows industry rankings based on fundamentals, combined technical and fundamentals, and on price alone. The site also shows daily industry movements. |
||||||||||||||||||||||||||||||||||||||||
|
# of Breakouts
|
Period Average1
|
Max. Gain During Period2
|
Gain at Period Close3
|
|
|---|---|---|---|---|
| This Week | 10 | 19.62 | 5.12% | 3.36% |
| Last Week | 21 | 19.85 | 4.05% | 0.93% |
| 13 Weeks | 283 | 20.62 | 10.5% |
6.18% |
2This represents the return if each stock were bought at its breakout price and sold at its intraday high.
3This represents the return if each stock were bought at its breakout price and sold at the most recent close.
|
Category
|
Symbol
|
Company Name
|
Expected Gain1
|
|---|---|---|---|
| Best Overall | SNSS | Sunesis Pharmaceuticals, Inc. | 112 |
| Top Technical | SNSS | Sunesis Pharmaceuticals, Inc. | 112 |
| Top Fundamental | KORS | Michael Kors Holdings Ltd | 29 |
| Top Tech. & Fund. | KORS | Michael Kors Holdings Ltd | 29 |
|
Category
|
Symbol
|
Company Name
|
Expected Gain1
|
|---|---|---|---|
| Best Overall | SWC | Stillwater Mining Company | 65 |
| Top Technical | AGO | Assured Guaranty Ltd. | 35 |
| Top Fundamental | LOPE | Grand Canyon Education Inc | 48 |
| Top Tech. & Fund. | LOPE | Grand Canyon Education Inc | 48 |
If you received this newsletter from a friend and you would like to receive it regularly please go to the BreakoutWatch.com site and enter as a Guest. You will then be able to register to receive the newsletter.
Copyright © 2013 NBIcharts, LLC dba
BreakoutWatch.com. All rights reserved.
" BreakoutWatch," the BreakoutWatch.com "eye" logo, and
the slogan "tomorrow's breakouts today" are service marks
of NBIcharts LLC. All other marks are the property of
their respective owners, and are used for descriptive
purposes only.
BreakoutWatch is not affiliated with Investor's Business
Daily or with Mr. William O'Neil. Our site, research and
analysis is supported entirely by subscription and is free
from advertising.