| Market Summary | Weekly Breakout Report | Top Breakout Choices | Top 2nd Chances | New Features | Tip of the Week |
Our caution over the
markets reaction to the implementation of the sequester
proved misplaced as the NASDAQ continued to move higher
each day this week except Wednesday. Tuesday brought an
accumulation day with a move higher on greater average
volume, but in general volumes were below average. Even
Friday's modest gain in response to a promising employment
report was made on the lowest volume level of the week.
The NASDAQ's gain for the week outperformed the other major indexes, but upward movement on lower volume usually indicates the trend is weakening. The chart shows the lower volumes and also that the index is reaching it's upper trendline limit.
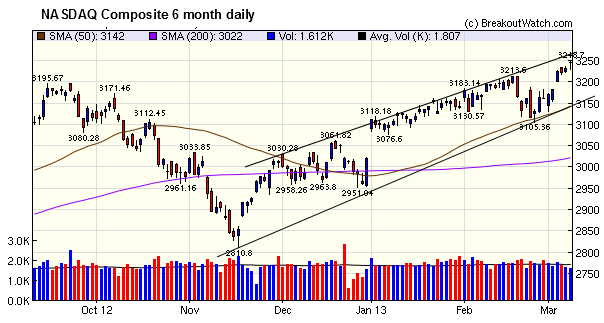
The lower volume also constrained the number of breakouts which were again well below the 13 week average.
The NASDAQ's gain for the week outperformed the other major indexes, but upward movement on lower volume usually indicates the trend is weakening. The chart shows the lower volumes and also that the index is reaching it's upper trendline limit.
The lower volume also constrained the number of breakouts which were again well below the 13 week average.
Important Notice
We have outgrown our current server
and must move to a newer, faster server in the near
future. Preparations for the move are well under way
and we plan to move next weekend. This may result in
some service interruptions next Saturday and or Sunday
(March 16 and 17). Because of the move there will be
no newsletter next week.
No new features this week.
In his Washington Post article this weekend, Barry Ritholz explains why the daily attention that investors pay to politics and the economy is misplaced. While his analysis is mostly true for investors, it does not apply to traders who make their profits and losses on the daily "noise".
| Index | Value | Change Week | Change YTD | Trend | ||||||||||||||||||||||||||||||||||||
|---|---|---|---|---|---|---|---|---|---|---|---|---|---|---|---|---|---|---|---|---|---|---|---|---|---|---|---|---|---|---|---|---|---|---|---|---|---|---|---|---|
| Dow | 14397.1 | 2.18% | 9.87% | Up | ||||||||||||||||||||||||||||||||||||
| NASDAQ | 3244.37 | 2.35% | 7.45% | Up | ||||||||||||||||||||||||||||||||||||
| S&P 500 | 1551.18 | 2.17% | 8.76% | Up | ||||||||||||||||||||||||||||||||||||
1The Market Signal is
derived from our proprietary market model. The
market model is described on the site.
2The site also shows industry rankings based on fundamentals, combined technical and fundamentals, and on price alone. The site also shows daily industry movements. |
||||||||||||||||||||||||||||||||||||||||
|
# of Breakouts
|
Period Average1
|
Max. Gain During Period2
|
Gain at Period Close3
|
|
|---|---|---|---|---|
| This Week | 12 | 19.54 | 2.74% | 1.3% |
| Last Week | 11 | 19.08 | 6.16% | 3.14% |
| 13 Weeks | 274 | 20 | 13.04% |
8.09% |
2This represents the return if each stock were bought at its breakout price and sold at its intraday high.
3This represents the return if each stock were bought at its breakout price and sold at the most recent close.
|
Category
|
Symbol
|
Company Name
|
Expected Gain1
|
|---|---|---|---|
| Best Overall | OREX | Orexigen Therapeutics, Inc. | 94 |
| Top Technical | OREX | Orexigen Therapeutics, Inc. | 94 |
| Top Fundamental | WNC | Wabash National Corporation | 70 |
| Top Tech. & Fund. | RGR | Sturm, Ruger & Company | 39 |
|
Category
|
Symbol
|
Company Name
|
Expected Gain1
|
|---|---|---|---|
| Best Overall | ADY | Feihe International Inc | 80 |
| Top Technical | IMI | Intermolecular Inc | 60 |
| Top Fundamental | NEWP | Newport Corporation | 40 |
| Top Tech. & Fund. | THRM | Gentherm Inc | 36 |
If you received this newsletter from a friend and you would like to receive it regularly please go to the BreakoutWatch.com site and enter as a Guest. You will then be able to register to receive the newsletter.
Copyright © 2013 NBIcharts, LLC dba BreakoutWatch.com.
All rights reserved.
" BreakoutWatch," the BreakoutWatch.com "eye" logo, and
the slogan "tomorrow's breakouts today" are service marks
of NBIcharts LLC. All other marks are the property of
their respective owners, and are used for descriptive
purposes only.
BreakoutWatch is not affiliated with Investor's Business
Daily or with Mr. William O'Neil.
Our site, research and analysis is supported entirely by
subscription and is free from advertising.