| Market Summary | Weekly Breakout Report | Top Breakout Choices | Top 2nd Chances | New Features | Tip of the Week |
Our market trend indicators point down for the the third successive week as the major indexes continue to consolidate. The once best performing NASDAQ Composite has now slipped back and the DJI is now the top performer year-to-date. This rotation out of mostly tech oriented, smaller cap stocks in favor of blue chips indicates investors currently prefer safety over more risky assets.
The NASDAQ found support on Thursday at 3168 and recovered on Friday to within striking distance of the 50 day moving average. A move above that level makes a test of resistance in the 3260-3270 range possible otherwise the index will likely retest the 3168 support level.

The number of successful breakouts fell to 8 this week, well below the thirteen week average of 13. While successful breakouts are possible when our trend indicators are down, there are always fewer of them and gains are smaller. See this week's Top Tip.
I'm pleased to report that our new server is now stable and there were no incidents this week.
No new features this week.
Using Our Trend Indicators will Improve your Returns
Our trend indicators have gone through several iterations of progressive improvement over the ten years we have been providing our service and in their current incarnation provide a reliable tool for detecting significant market turns. Our backtest tools show that relying on our trend indicators will significantly improve your returns over time.
Consider the following results from our CwH tool for the last year when using the market signals to determine when to buy. That is, by opening a position only when the NASDAQ trend indicator is up.
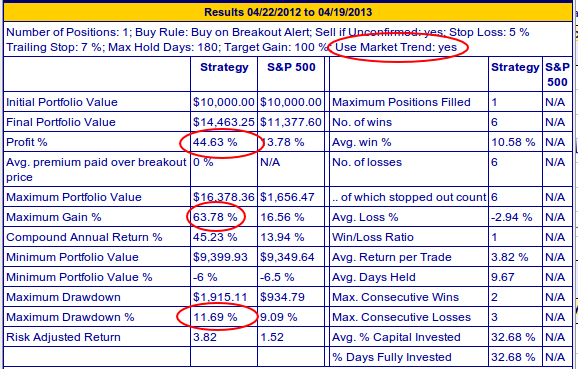
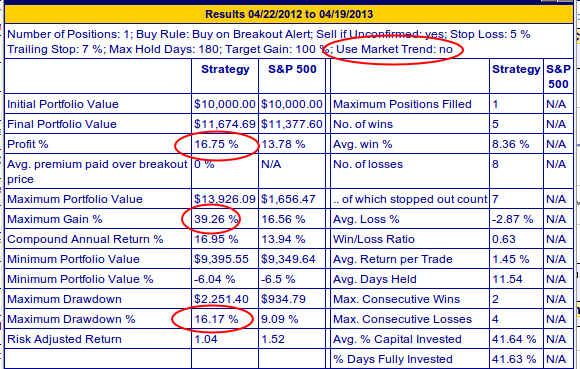
Special Note: We ran these backtests using just 1 position because that ensures our maximum return.
The reason is that with one position, more of our capital is working for us than with multiple positions. This arises because not all breakouts meet our selection criteria. With one position we commit 100% of our available capital to each buy but with two or more positions we are diluting the amount committed to each position. Because the breakouts can be several days apart, a proportion of our capital can be idle for several days.
| Index | Value | Change Week | Change YTD | Trend | ||||||||||||||||||||||||||||||||||||
|---|---|---|---|---|---|---|---|---|---|---|---|---|---|---|---|---|---|---|---|---|---|---|---|---|---|---|---|---|---|---|---|---|---|---|---|---|---|---|---|---|
| Dow | 14547.5 | -2.14% | 11.01% | Down | ||||||||||||||||||||||||||||||||||||
| NASDAQ | 3206.06 | -2.7% | 6.18% | Down | ||||||||||||||||||||||||||||||||||||
| S&P 500 | 1555.25 | -2.11% | 9.05% | Down | ||||||||||||||||||||||||||||||||||||
1The Market Signal is derived
from our proprietary market model. The market model is
described on the site.
2The site also shows industry rankings based on fundamentals, combined technical and fundamentals, and on price alone. The site also shows daily industry movements. |
||||||||||||||||||||||||||||||||||||||||
|
# of Breakouts
|
Period Average1
|
Max. Gain During Period2
|
Gain at Period Close3
|
|
|---|---|---|---|---|
| This Week | 8 | 12.23 | 4.31% | 3.43% |
| Last Week | 9 | 13.31 | 2.31% | -2.01% |
| 13 Weeks | 199 | 13.92 | 8.18% |
-0.64% |
2This represents the return if each stock were bought at its breakout price and sold at its intraday high.
3This represents the return if each stock were bought at its breakout price and sold at the most recent close.
|
Category
|
Symbol
|
Company Name
|
Expected Gain1
|
|---|---|---|---|
| Best Overall | UNTD | United Online, Inc. | 108 |
| Top Technical | UNTD | United Online, Inc. | 108 |
| Top Fundamental | SODA | Sodastream International Ltd | 42 |
| Top Tech. & Fund. | LUFK | Lufkin Industries, Inc. | 30 |
|
Category
|
Symbol
|
Company Name
|
Expected Gain1
|
|---|---|---|---|
| Best Overall | NKTR | Nektar Therapeutics | 82 |
| Top Technical | UNG | United States Natural Gas Fund, LP | 38 |
| Top Fundamental | IMOS | ChipMOS Technologies (Bermuda) Ltd | 65 |
| Top Tech. & Fund. | IMOS | ChipMOS Technologies (Bermuda) Ltd | 65 |
If you received this newsletter from a friend and you would like to receive it regularly please go to the BreakoutWatch.com site and enter as a Guest. You will then be able to register to receive the newsletter.
Copyright © 2013 NBIcharts, LLC dba BreakoutWatch.com. All rights
reserved.
" BreakoutWatch," the BreakoutWatch.com "eye" logo, and the slogan
"tomorrow's breakouts today" are service marks of NBIcharts LLC.
All other marks are the property of their respective owners, and
are used for descriptive purposes only.
BreakoutWatch is not affiliated with Investor's Business Daily or
with Mr. William O'Neil. Our site, research and analysis is
supported entirely by subscription and is free from advertising.