| Market Summary | Weekly Breakout Report | Top Breakout Choices | Top 2nd Chances | New Features | Tip of the Week |
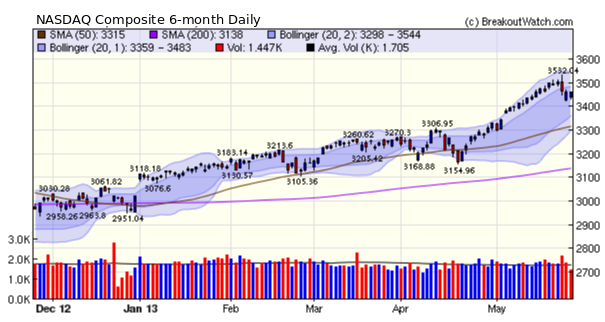
Our market trend signals for the NASDAQ and S&P 500 turned negative on Thursday and for the DJI on Friday. The downturn followed the sharp fall in the major indexes on Wednesday following Fed Chairman Bernanke's comment to congress which left open the possibility that the Fed will withdraw its $US85 billion a month quantative easing program this year. Our NASDAQ chart shows a modest recovery on Thursday and Friday but the much weaker volume indicates support for the gains was tentative. Some consolidation was inevitable after the steep rise in the index since mid-April, so the sudden reversal is not necessarily an indication that a correction is at hand. It can be argued that the markets' reaction to Bernanke's comments was an overreaction as unemployment must fall substantially further before the Fed's mandate to maintain full employment is reached and the full impact of job cuts from sequestration is still to be felt.
Nevertheless, we always suggest caution in taking new positions when our market trend signals turn negative. Note that the number of breakouts fell below the 13 week average this week and overall gains were much more modest than in recent weeks.
No new features this week.
We wish all our subscribers a safe and enjoyable Memorial Day weekend.
| Index | Value | Change Week | Change YTD | Trend | ||||||||||||||||||||||||||||||||||||
|---|---|---|---|---|---|---|---|---|---|---|---|---|---|---|---|---|---|---|---|---|---|---|---|---|---|---|---|---|---|---|---|---|---|---|---|---|---|---|---|---|
| Dow | 15303.1 | -0.33% | 16.78% | Down | ||||||||||||||||||||||||||||||||||||
| NASDAQ | 3459.14 | -1.14% | 14.56% | Down | ||||||||||||||||||||||||||||||||||||
| S&P 500 | 1649.6 | -0.99% | 15.66% | Down | ||||||||||||||||||||||||||||||||||||
1The Market Signal is derived
from our proprietary market model. The market model is
described on the site.
2The site also shows industry rankings based on fundamentals, combined technical and fundamentals, and on price alone. The site also shows daily industry movements. |
||||||||||||||||||||||||||||||||||||||||
|
# of Breakouts
|
Period Average1
|
Max. Gain During Period2
|
Gain at Period Close3
|
|
|---|---|---|---|---|
| This Week | 8 | 11.92 | 4.5% | 2.03% |
| Last Week | 10 | 11.77 | 4.98% | 0.34% |
| 13 Weeks | 188 | 12.38 | 11.19% |
3.28% |
2This represents the return if each stock were bought at its breakout price and sold at its intraday high.
3This represents the return if each stock were bought at its breakout price and sold at the most recent close.
|
Category
|
Symbol
|
Company Name
|
Expected Gain1
|
|---|---|---|---|
| Best Overall | HOV | Hovnanian Enterprises, Inc. | 105 |
| Top Technical | HOV | Hovnanian Enterprises, Inc. | 105 |
| Top Fundamental | RPXC | RPX Corp | 46 |
| Top Tech. & Fund. | ANFI | Amira Nature Foods Ltd | 65 |
|
Category
|
Symbol
|
Company Name
|
Expected Gain1
|
|---|---|---|---|
| Best Overall | TASR | TASER International, Inc. | 88 |
| Top Technical | AMBA | Ambarella Inc | 70 |
| Top Fundamental | AMBA | Ambarella Inc | 70 |
| Top Tech. & Fund. | AMBA | Ambarella Inc | 70 |
If you received this newsletter from a friend and you would like to receive it regularly please go to the BreakoutWatch.com site and enter as a Guest. You will then be able to register to receive the newsletter.
Copyright © 2013 NBIcharts, LLC dba BreakoutWatch.com. All rights
reserved.
" BreakoutWatch," the BreakoutWatch.com "eye" logo, and the slogan
"tomorrow's breakouts today" are service marks of NBIcharts LLC.
All other marks are the property of their respective owners, and
are used for descriptive purposes only.
BreakoutWatch is not affiliated with Investor's Business Daily or
with Mr. William O'Neil.
Our site, research and analysis is supported entirely by
subscription and is free from advertising.