| Market Summary | Weekly Breakout Report | Top Breakout Choices | Top 2nd Chances | New Features | Tip of the Week |
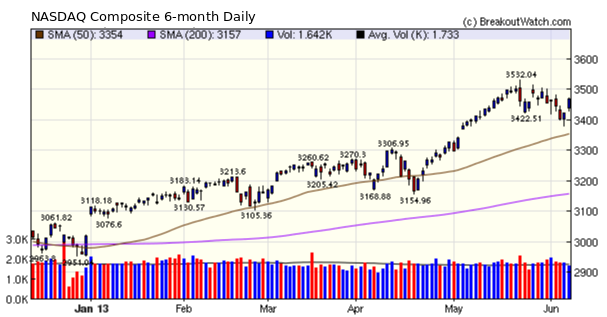
The markets rallied on Friday as non-farm payrolls improved but not enough to prod the Fed to scale-back its quantitative easing (QE) program in the near future. However, you can see from the chart that volume was well below the recent average, indicating strong reservations that the rally could be sustained. The markets are likely to continue to fret over the possibility of an end to QE until the moment it happens, in case look out below. For this reason, I think the recent high on June 7 is the high water mark for the medium term, perhaps for the year.
Our market trend s still point down but quality stocks can still make healthy gains as this week's breakouts show. Of the 6 stocks earning more than 5% after breakout, 5 of t hem had RS ranks of over 92 - our recommended minimum for opening a long position.
| Date | Symbol | Base | BoP | Friday Close | RS Rank | Gain | Intraday High
|
| 6/4/2013 | DANG | CwH | 6.62 | 94 | 7.34 | 10.88% | 10.88% |
| 6/3/2013 | MNKD | HTF | 6.85 | 99 | 7.46 | 8.91% | 12.12% |
| 6/6/2013 | TTS | CwH | 26.46 | 96 | 28.78 | 8.77% | 8.77% |
| 6/3/2013 | SCOR | CwH | 20.29 | 83 | 21.86 | 7.74% | 7.74% |
| 6/6/2013 | TECUA | CwH | 9.42 | 95 | 10.07 | 6.90% | 9.34% |
Mobile Version Improvements
Have you thought of accessing BoW on your smartphone device or tablet? Maybe you have tried it and found it difficult to use. If so, then you may want to take another look following some improvements made this week on the suggestion of a subscriber who accesses BoW on his Android device.
If you access http://www.breakoutwatch.com/mobile on your mobile device, you will be redirected to our mobile menu page.
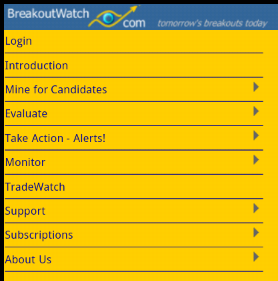
Tapping any of the menu choices will bring up the next menu level. Eventually you will get to a watchlist:
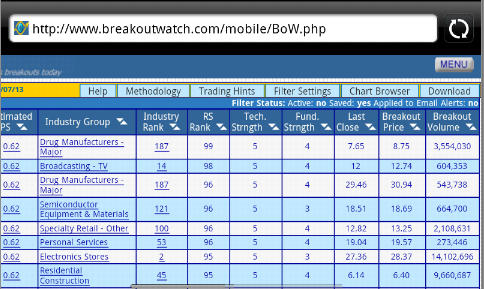
To return to the menu, tap the
MENU button at the top right.
Please try it and send me your feedback.
Please try it and send me your feedback.
This feature will return next week with a new turn signals tool.
| Index | Value | Change Week | Change YTD | Trend | ||||||||||||||||||||||||||||||||||||
|---|---|---|---|---|---|---|---|---|---|---|---|---|---|---|---|---|---|---|---|---|---|---|---|---|---|---|---|---|---|---|---|---|---|---|---|---|---|---|---|---|
| Dow | 15248.1 | 0.88% | 16.36% | Down | ||||||||||||||||||||||||||||||||||||
| NASDAQ | 3469.22 | 0.39% | 14.89% | Down | ||||||||||||||||||||||||||||||||||||
| S&P 500 | 1643.38 | 0.78% | 15.23% | Down | ||||||||||||||||||||||||||||||||||||
1The Market Signal is derived
from our proprietary market model. The market model is
described on the site.
2The site also shows industry rankings based on fundamentals, combined technical and fundamentals, and on price alone. The site also shows daily industry movements. |
||||||||||||||||||||||||||||||||||||||||
|
# of Breakouts
|
Period Average1
|
Max. Gain During Period2
|
Gain at Period Close3
|
|
|---|---|---|---|---|
| This Week | 15 | 12.31 | 4.98% | 4.15% |
| Last Week | 12 | 12.08 | 3.18% | 0.58% |
| 13 Weeks | 185 | 13.23 | 11.83% |
3.52% |
2This represents the return if each stock were bought at its breakout price and sold at its intraday high.
3This represents the return if each stock were bought at its breakout price and sold at the most recent close.
|
Category
|
Symbol
|
Company Name
|
Expected Gain1
|
|---|---|---|---|
| Best Overall | FBP | First Bancorp | 99 |
| Top Technical | FBP | First Bancorp | 99 |
| Top Fundamental | NTSP | NetSpend Holdings Inc | 43 |
| Top Tech. & Fund. | NTSP | NetSpend Holdings Inc | 43 |
|
Category
|
Symbol
|
Company Name
|
Expected Gain1
|
|---|---|---|---|
| Best Overall | RFIL | RF Industries, Ltd. | 113 |
| Top Technical | JKS | JinkoSolar Holding Co., Ltd. | 91 |
| Top Fundamental | RFIL | RF Industries, Ltd. | 113 |
| Top Tech. & Fund. | RFIL | RF Industries, Ltd. | 113 |
If you received this newsletter from a friend and you would like to receive it regularly please go to the BreakoutWatch.com site and enter as a Guest. You will then be able to register to receive the newsletter.
Copyright © 2013 NBIcharts, LLC dba BreakoutWatch.com. All rights
reserved.
" BreakoutWatch," the BreakoutWatch.com "eye" logo, and the slogan
"tomorrow's breakouts today" are service marks of NBIcharts LLC.
All other marks are the property of their respective owners, and
are used for descriptive purposes only.
BreakoutWatch is not affiliated with Investor's Business Daily or
with Mr. William O'Neil. Our site, research and analysis is
supported entirely by subscription and is free from advertising.