| Market Summary | Weekly Breakout Report | Top Breakout Choices | Top 2nd Chances | New Features | Tip of the Week |
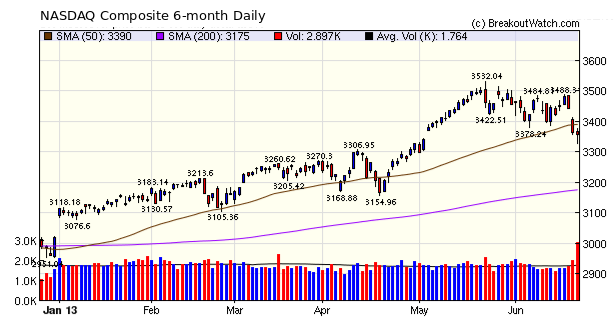
It has been clear for some time that any hint at withdrawal of QE by Fed Chairman Bernanke would send a shudder through the markets, Thursday's gap down was unquestionably an overreaction, as there is still some time to go before the punchbowl is taken away. The strong recovery, at least for the S&P 500 and DJI, on Friday saw a return to sanity. The strong surge off the day's bottom even caused our market signal for the S&P 500 to turn positive. But with both trend indicators for the DJI and NASDAQ still pointing down, further caution is necessary. At times like these, caution is self-imposed, because the number of breakouts drops dramatically. There were only four this week and gains were slim.
I expect the NASDAQ will recover further and trade between 3400 and 3500 in the short term.
Our Trend Reversal Signals for individual stocks makes a return this week. After extensive research and considerable back testing against the old algorithm, I have a new version in place based on Fractal geometry.
As before, you can access it from Evaluate > Analytical Tools > Stock Reversal Signals.
New Trend Reversal Signals
Our former algorithm was based on oversold and undersold indicators for the RSI stochastic indicator with the accumulation/distribution indicator for confirmation. A weakness of all indicators of this type is that although they work quite well when the symbol under study is trending, they give several false signals when the stock is moving predominately sideways. I had attempted to allow for this by modifying the periods used for the indicators based on the short term standard deviation but there were still too many false signals.
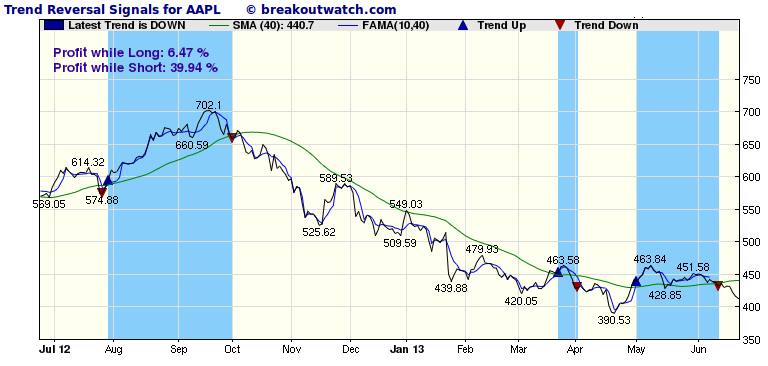
The new algorithm is based on fractal geometry. It has been observed that stock price movements can be modeled using fractal techniques and on the Trend Reversal Signals page I link to the original article by John Ehrlers describing the methodology.
The new Trend Reversal Signal tool uses a "Fractal Moving Overage" crossover with a 40 day simple moving average to generate buy and sell signals. The tool also allows you to modify the fractal "window" and SMA period so you can experiment with your own settings. This image shows the reversal signals for AAPL over the last twelve months and shows that using these signals one would have been profitable both on the long and short side.
| Index | Value | Change Week | Change YTD | Trend | ||||||||||||||||||||||||||||||||||||
|---|---|---|---|---|---|---|---|---|---|---|---|---|---|---|---|---|---|---|---|---|---|---|---|---|---|---|---|---|---|---|---|---|---|---|---|---|---|---|---|---|
| Dow | 14799.4 | -1.8% | 12.94% | Down | ||||||||||||||||||||||||||||||||||||
| NASDAQ | 3357.25 | -1.94% | 11.19% | Down | ||||||||||||||||||||||||||||||||||||
| S&P 500 | 1592.43 | -2.11% | 11.66% | Up | ||||||||||||||||||||||||||||||||||||
1The Market Signal is derived
from our proprietary market model. The market model is
described on the site.
2The site also shows industry rankings based on fundamentals, combined technical and fundamentals, and on price alone. The site also shows daily industry movements. |
||||||||||||||||||||||||||||||||||||||||
|
# of Breakouts
|
Period Average1
|
Max. Gain During Period2
|
Gain at Period Close3
|
|
|---|---|---|---|---|
| This Week | 4 | 11.23 | 3.56% | 2.23% |
| Last Week | 12 | 11.92 | 6.66% | -1.04% |
| 13 Weeks | 158 | 12.23 | 12.05% |
0.2% |
2This represents the return if each stock were bought at its breakout price and sold at its intraday high.
3This represents the return if each stock were bought at its breakout price and sold at the most recent close.
|
Category
|
Symbol
|
Company Name
|
Expected Gain1
|
|---|---|---|---|
| Best Overall | CVTI | Covenant Transportation Group, Inc. | 104 |
| Top Technical | CVTI | Covenant Transportation Group, Inc. | 104 |
| Top Fundamental | INVN | InvenSense Inc | 56 |
| Top Tech. & Fund. | INVN | InvenSense Inc | 56 |
|
Category
|
Symbol
|
Company Name
|
Expected Gain1
|
|---|---|---|---|
| Best Overall | IN | Intermec Inc. | 48 |
| Top Technical | SZYM | Solazyme Inc | 48 |
| Top Fundamental | IN | Intermec Inc. | 48 |
| Top Tech. & Fund. | IN | Intermec Inc. | 48 |
If you received this newsletter from a friend and you would like to receive it regularly please go to the BreakoutWatch.com site and enter as a Guest. You will then be able to register to receive the newsletter.
Copyright © 2013 NBIcharts, LLC dba BreakoutWatch.com. All rights
reserved.
" BreakoutWatch," the BreakoutWatch.com "eye" logo, and the slogan
"tomorrow's breakouts today" are service marks of NBIcharts LLC.
All other marks are the property of their respective owners, and
are used for descriptive purposes only.
BreakoutWatch is not affiliated with Investor's Business Daily or
with Mr. William O'Neil.
Our site, research and analysis is supported entirely by
subscription and is free from advertising.