| Market Summary | Weekly Breakout Report | Top Breakout Choices | Top 2nd Chances | New Features | Tip of the Week |
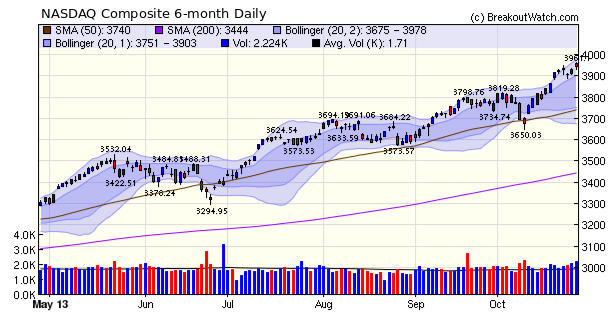
Volume was above average each day this week showing improving confidence in the upward market trends. Volumes also improved in the latter four days delivering three accumulation days for the NASDAQ Composite (an accumulation day is when a stock or index rises on increasing volume). The result was a new 13 year high for the NASDAQ which has seen a 30% rise year to date. My reading of the NASDAQ chart says that we should expect a 2-3% correction over the next two weeks.
Top breakout for the week was Pacer International (PACR) which broke out of a shallow CwH pattern on Friday and closed 12.5% above its breakout price.
If you think that the $13billion settlement with J.P. Morgan is excessive, consider that they had reserves of $28billion against liabilities arising from the acquisition of WaMu and Bear Sterns. And for a brilliant take-down of CNBC and Fox News' analysts watch Nightmare on Wall Street. This was so good I couldn't resist sharing it!
Bug Fix
Thanks to the efforts of a Trial subscriber I corrected a bug in the Tradewatch Backtest program this week. To understand the bug, you need to know that we adjust historical prices for splits and dividends so that price and volume charts are consistent. The bug arose out of the original breakout price not being adjusted for historical price corrections resulting from splits and distributions. (See more below).
For example, suppose the original breakout price for a stock was $10 and there was a subsequent 2 for 1 split. The adjusted BoP should now be $5. Suppose now that the stock rises and is sold after a 50% gain for an adjusted price of $7.50. The backtest was comparing the sell price of $7.50 to the unadjusted BoP of $10 and recording a $25% loss. This has now been corrected so the original BoP is adjusted by the appropriate split factor.
Additionally, the reports of trades filed/not filled now report results only for the year -to-date.
Should you Consider TradeWatch?
Tradewatch is designed for subscribers who cannot follow the market in real time. I developed it in 2006 because I live in Hawaii where the market opens at 3:30 am in summer and 4:30 am in winter. My goal was to establish a set of criteria for selecting stocks on which I could place buy and sell orders the previous evening, and have a reasonable expectation that on average these stocks would out perform the market averages.
While TradeWatch performed well at first, it failed to deliver good results in the long bear market that began in 2007 and I lost interest in it. The result was that I didn't pay as much attention to maintaining the product as I should, which led to my failing to notice the bug which was fixed this week.
Looking at results for this year, though, I see that Tradewatch is again delivering good results. If you are in a situation where you cannot trade real time, then I suggest that both the "Buy at Open" and "Buy on Breakout" watchlists deserve your attention.
For example, the "Buy at Open" strategy has delivered stocks that have averaged a 28% gain for the year to date, and the "Buy on Breakout" strategy, which is a little more conservative, delivered average gains of 22%. When you consider that these trades are open only for a few days, then the results of compounding can be significant.
For example, a backtest of a 4 position "Buy at Open" portfolio since the start of the year, returned 68%.
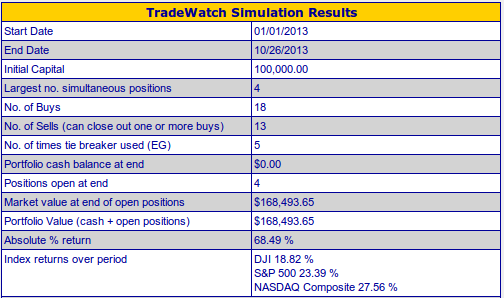
You can test various scenarios using our Tradewatch History Portfolio Simulation tool on the Tradewatch page.
| Index | Value | Change Week | Change YTD | Trend | ||||||||||||||||||||||||||||||||||||
|---|---|---|---|---|---|---|---|---|---|---|---|---|---|---|---|---|---|---|---|---|---|---|---|---|---|---|---|---|---|---|---|---|---|---|---|---|---|---|---|---|
| Dow | 15570.3 | 1.11% | 18.82% | Up | ||||||||||||||||||||||||||||||||||||
| NASDAQ | 3943.36 | 0.74% | 30.6% | Up | ||||||||||||||||||||||||||||||||||||
| S&P 500 | 1759.77 | 0.88% | 23.39% | Up | ||||||||||||||||||||||||||||||||||||
1The Market Signal is derived
from our proprietary market model. The market model is
described on the site.
2The site also shows industry rankings based on fundamentals, combined technical and fundamentals, and on price alone. The site also shows daily industry movements. |
||||||||||||||||||||||||||||||||||||||||
|
# of Breakouts
|
Period Average1
|
Max. Gain During Period2
|
Gain at Period Close3
|
|
|---|---|---|---|---|
| This Week | 6 | 10.23 | 7.58% | 3.39% |
| Last Week | 13 | 10.23 | 16.35% | 6.85% |
| 13 Weeks | 132 | 10.77 | 19.5% |
8.24% |
2This represents the return if each stock were bought at its breakout price and sold at its intraday high.
3This represents the return if each stock were bought at its breakout price and sold at the most recent close.
|
Category
|
Symbol
|
Company Name
|
Expected Gain1
|
|---|---|---|---|
| Best Overall | PZZI | Pizza Inn, Inc. | 106 |
| Top Technical | PZZI | Pizza Inn, Inc. | 106 |
| Top Fundamental | AFSI | Amtrust Financial Services, Inc. | 35 |
| Top Tech. & Fund. | BOFI | BofI Holding, Inc. | 41 |
|
Category
|
Symbol
|
Company Name
|
Expected Gain1
|
|---|---|---|---|
| Best Overall | WETF | WisdomTree Investments, Inc. | 62 |
| Top Technical | ATK | Alliant Techsystems Inc. | 28 |
| Top Fundamental | WETF | WisdomTree Investments, Inc. | 62 |
| Top Tech. & Fund. | WETF | WisdomTree Investments, Inc. | 62 |
If you received this newsletter from a friend and you would like to receive it regularly please go to the BreakoutWatch.com site and enter as a Guest. You will then be able to register to receive the newsletter.
Copyright © 2013 NBIcharts, LLC dba BreakoutWatch.com. All rights
reserved.
" BreakoutWatch," the BreakoutWatch.com "eye" logo, and the slogan
"tomorrow's breakouts today" are service marks of NBIcharts LLC.
All other marks are the property of their respective owners, and
are used for descriptive purposes only.
BreakoutWatch is not affiliated with Investor's Business Daily or
with Mr. William O'Neil.
Our site, research and analysis is supported entirely by
subscription and is free from advertising.