| Market Summary | Weekly Breakout Report | Top Breakout Choices | Top 2nd Chances | New Features | Tip of the Week |
The NASDAQ Composite received support as it touched its 200 day moving average on Tuesday and has made a tentative recovery since then. However, volumes were well below average, possibly because of the short week, so this not yet a strong rally.
Our market signals remain down so caution is still advised.
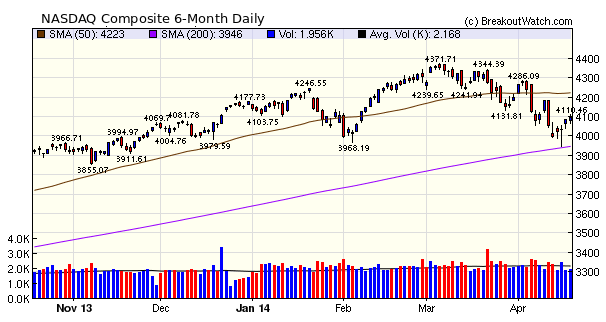
The number of breakouts fell again this week - unsurprising considering the market weakness and low volumes overall. Notice that all but one of the breakouts was in a squeeze.
| Breakouts for Week Beginning 04/14/14 | ||||||||
| Brkout Date | Symbol | Base | Squeeze | BrkoutOut Price | Brkout Day Close | Last Close | Current % off BOP | Gain at Intraday High |
|---|---|---|---|---|---|---|---|---|
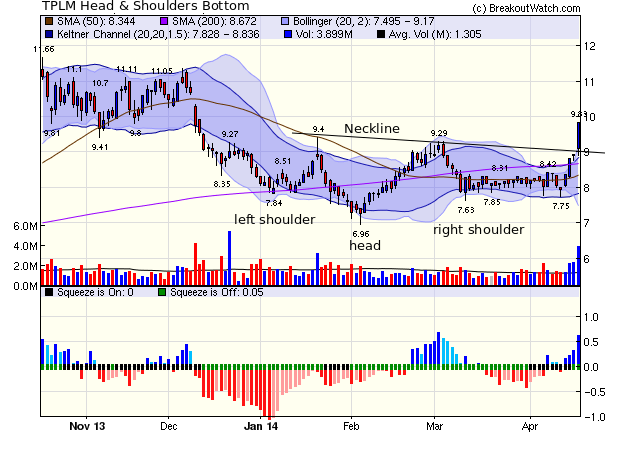
| 04/17/14 | TPLM | HSB | Y | 9.16 | 9.83 | 9.83 | 7.31 | 7.31 |
| 04/16/14 | MG | SQZ | Y | 23.37 | 24 | 24.03 | 2.82 | 2.82 |
| 04/16/14 | HFC | SQZ | Y | 49.67 | 50.31 | 50.8 | 2.28 | 2.28 |
| 04/17/14 | PPG | DB | N | 197.76 | 199.46 | 199.46 | 0.86 | 0.86 |
| 04/16/14 | NI | SQZ | Y | 35.99 | 36.3 | 35.92 | -0.19 | 0.86 |
| 04/17/14 | ALSN | DB | Y | 30.79 | 30.99 | 30.99 | 0.65 | 0.65 |
| 04/16/14 | CNS | SQZ | Y | 41.65 | 41.88 | 39.79 | -4.47 | 0.55 |
| 04/15/14 | AEE | SQZ | Y | 41.67 | 41.75 | 40.99 | -1.63 | 0.55 |
| 04/16/14 | ARE | SQZ | Y | 73.78 | 73.98 | 73.28 | -0.68 | 0.27 |
| Weekly Average (9 breakouts) | 0.77 | 1.79 | ||||||
No new features this week.
Recognizing a Head & Shoulders Bottom
This weeks top breakout (TPLM) came from a head and shoulders bottom (HSB) pattern. This pattern is the exact inverse of the head and shoulders top but can be hard to recognize because of its inverted state. To make the pattern clear, I've annotated the chart for TPLM to show the left and right shoulders, the head and the neckline. The pattern is considered bullish, just as its inverted cousin, the head and shoulders top, is considered bearish.
A breakout from a HSB occurs when the price rises above a line drawn between the two highs separating the shoulders from the head. This line is called the neckline.
| Index | Value | Change Week | Change YTD | Trend | ||||||||||||||||||||||||||||||||||||
|---|---|---|---|---|---|---|---|---|---|---|---|---|---|---|---|---|---|---|---|---|---|---|---|---|---|---|---|---|---|---|---|---|---|---|---|---|---|---|---|---|
| Dow | 16408.5 | 2.38% | -1.01% | Down | ||||||||||||||||||||||||||||||||||||
| NASDAQ | 4095.52 | 2.39% | -1.94% | Down | ||||||||||||||||||||||||||||||||||||
| S&P 500 | 1864.85 | 2.71% | 0.89% | Down | ||||||||||||||||||||||||||||||||||||
1The Market Signal is derived
from our proprietary market model. The market model is
described on the site.
2The site also shows industry rankings based on fundamentals, combined technical and fundamentals, and on price alone. The site also shows daily industry movements. |
||||||||||||||||||||||||||||||||||||||||
|
Category
|
Symbol
|
Company Name
|
Expected Gain1
|
|---|---|---|---|
| Best Overall | PAM | Pampa Energia S.A. | 105 |
| Top Technical | PAM | Pampa Energia S.A. | 105 |
| Top Fundamental | PII | Polaris Industries Inc. | 33 |
| Top Tech. & Fund. | BMA | Macro Bank Inc. | 61 |
|
Category
|
Symbol
|
Company Name
|
Expected Gain1
|
|---|---|---|---|
| Best Overall | No selection this week |
||
| Top Technical | No selection this week | ||
| Top Fundamental | No selection this week | ||
| Top Tech. & Fund. | No selection this week |
If you received this newsletter from a friend and you would like to receive it regularly please go to the BreakoutWatch.com site and enter as a Guest. You will then be able to register to receive the newsletter.
Copyright © 2014 NBIcharts, LLC dba BreakoutWatch.com. All rights
reserved.
" BreakoutWatch," the BreakoutWatch.com "eye" logo, and the slogan
"tomorrow's breakouts today" are service marks of NBIcharts LLC.
All other marks are the property of their respective owners, and
are used for descriptive purposes only.
BreakoutWatch is not affiliated with Investor's Business Daily or
with Mr. William O'Neil. Our site, research and analysis is
supported entirely by subscription and is free from advertising.