| Market Summary | Weekly Breakout Report | Top Breakout Choices | Top 2nd Chances | New Features | Tip of the Week |
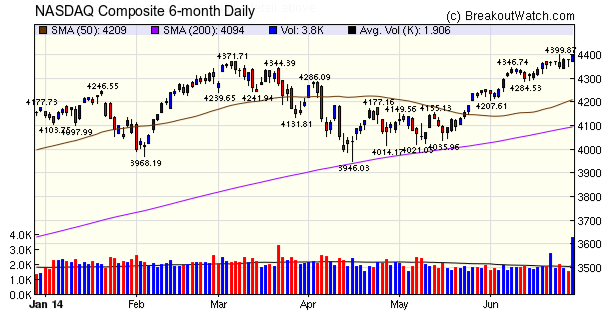
After bumping up against resistance all week the NASDAQ finally broke through on strong volume on Friday. The reason for volume being more than double the 50 day average was unclear, but the tech sector was buoyant on the successful IPO of GoPro which rose 38% above its initial offering price.

The number of breakouts fell slightly from last week but remained at a high level. The overall market strength meant that our watchlists were dominated by the cup with handle and Squeeze Play patterns. The top performer was WUBA which I discuss further in my Top Tip below.
| Breakouts for Week Beginning 06/23/14 | ||||||||
| Brkout Date | Symbol | Base | Squeeze | BrkoutOut Price | Brkout Day Close | Last Close | Current % off BOP | Gain at Intraday High |
|---|---|---|---|---|---|---|---|---|
| 06/26/14 | WUBA | CwH | N | 46.73 | 52.22 | 54.9 | 17.48 | 20.91 |
| 06/26/14 | MEI | CwH | N | 34.18 | 37.68 | 36.79 | 7.64 | 12.14 |
| 06/25/14 | MEG | SQZ | Y | 19.37 | 20.33 | 20.45 | 5.58 | 9.09 |
| 06/25/14 | SIMO | CwH | N | 18.47 | 18.84 | 19.84 | 7.42 | 7.69 |
| 06/23/14 | BCRX | CwH | N | 12.00 | 12.00 | 12.52 | 4.33 | 6.25 |
| 06/25/14 | GTN | CwH | N | 12.16 | 12.20 | 12.79 | 5.18 | 5.59 |
| 06/27/14 | EGO | CwH | N | 7.24 | 7.56 | 7.56 | 4.42 | 5.39 |
| 06/25/14 | CBK | CwH | N | 8.72 | 9.04 | 8.93 | 2.41 | 4.93 |
| 06/27/14 | CLDN | CwH | N | 14.47 | 15.00 | 15 | 3.66 | 4.63 |
| 06/27/14 | HHC | SQZ | Y | 152.66 | 158.11 | 158.11 | 3.57 | 3.57 |
| 06/27/14 | NRF | SQZ | Y | 17.28 | 17.64 | 17.64 | 2.08 | 3.41 |
| 06/23/14 | FSLR | CwH | N | 69.75 | 70.15 | 71.4 | 2.37 | 3.23 |
| 06/24/14 | BPL | SQZ | Y | 80.97 | 81.25 | 82.59 | 2.00 | 3.01 |
| 06/27/14 | BAS | SQZ | Y | 27.91 | 28.32 | 28.32 | 1.47 | 2.87 |
| 06/25/14 | NCS | CwH | N | 18.85 | 18.98 | 19.05 | 1.06 | 2.81 |
| 06/25/14 | BDC | CwH | N | 77.05 | 77.17 | 78.83 | 2.31 | 2.79 |
| 06/27/14 | PATK | CwH | N | 43.46 | 44.19 | 44.19 | 1.68 | 2.6 |
| 06/27/14 | AHT | SQZ | Y | 11.24 | 11.51 | 11.51 | 2.40 | 2.4 |
| 06/23/14 | PZE | CwH | N | 6.67 | 6.83 | 6.33 | -5.10 | 2.4 |
| 06/23/14 | ACT | SQZ | Y | 221.19 | 221.35 | 223.27 | 0.94 | 2.28 |
| 06/27/14 | CRR | CwH | N | 147.25 | 149.94 | 149.94 | 1.83 | 2.16 |
| 06/27/14 | MMSI | SQZ | Y | 14.95 | 15.2 | 15.2 | 1.67 | 1.94 |
| 06/23/14 | IPXL | SQZ | Y | 30.10 | 30.36 | 30.25 | 0.50 | 1.93 |
| 06/27/14 | IGTE | SQZ | Y | 35.25 | 35.81 | 35.81 | 1.59 | 1.9 |
| 06/23/14 | INVN | CwH | N | 22.09 | 22.45 | 21.99 | -0.45 | 1.63 |
| 06/24/14 | IDXX | SQZ | Y | 132.72 | 134.38 | 133.71 | 0.75 | 1.63 |
| 06/27/14 | ZINC | CwH | N | 17.90 | 18.15 | 18.15 | 1.40 | 1.56 |
| 06/27/14 | GMT | SQZ | Y | 66.38 | 67.25 | 67.25 | 1.31 | 1.39 |
| 06/27/14 | MPO | CwH | N | 7.34 | 7.40 | 7.4 | 0.82 | 1.09 |
| 06/27/14 | LPI | CwH | N | 30.72 | 30.74 | 30.74 | 0.07 | 0.98 |
| 06/27/14 | ALKS | CwH | N | 50.88 | 50.94 | 50.94 | 0.12 | 0.14 |
| Weekly Average (31 breakouts) | 2.66 | 4.01 | ||||||
No new features this week
Cup and Handle Analysis - WUBA

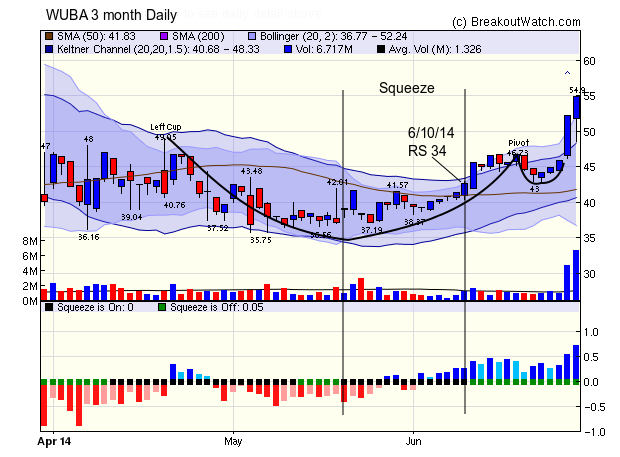
If you had studied the chart for WUBA on Wednesday evening (6/25/14) there were three indications that this could be a strong breakout:
- On 6/11 there was a strong breakout from a squeeze situation. You can see the stock was ascending the right side of a cup at the time before forming the pivot of a cup and handle on 6/18. While ascending the cup there was a strong breakout on 6/11 from a squeeze situation. This strong squeeze breakout was an indication that there was potential for the stock to go higher. Note that the RS for the stock before the squeeze breakout was only 34 - well below the 70 that is needed for it to qualify for our squeeze play watchlist, which looks for stocks in the right side of a cup.
- The handle showed an almost perfect formation - falling on lower volume after the pivot and then rising on progressively higher volume before the breakout. (see Anatomy of a Cup-with-Handle Chart Pattern).
- As the stock rose in the handle there was quite strong buying pressure with volume at the average daily volume level and momentum (look at the lower chart) was increasing.
These factors didn't guarantee a breakout on 6/26 but they increased the odds. Trading is a game of probabilities so you must look for the little things that can give you an edge.
| Index | Value | Change Week | Change YTD | Trend | ||||||||||||||||||||||||||||||||||||
|---|---|---|---|---|---|---|---|---|---|---|---|---|---|---|---|---|---|---|---|---|---|---|---|---|---|---|---|---|---|---|---|---|---|---|---|---|---|---|---|---|
| Dow | 16851.8 | -0.56% | 1.66% | Up | ||||||||||||||||||||||||||||||||||||
| NASDAQ | 4397.93 | 0.68% | 5.3% | Up | ||||||||||||||||||||||||||||||||||||
| S&P 500 | 1960.96 | -0.1% | 6.09% | Up | ||||||||||||||||||||||||||||||||||||
1The Market Signal is derived
from our proprietary market model. The market model is
described on the site.
2The site also shows industry rankings based on fundamentals, combined technical and fundamentals, and on price alone. The site also shows daily industry movements. |
||||||||||||||||||||||||||||||||||||||||
|
Category
|
Symbol
|
Company Name
|
Expected Gain1
|
|---|---|---|---|
| Best Overall | SAND | Sandstorm Gold Ltd | 107 |
| Top Technical | SAND | Sandstorm Gold Ltd | 107 |
| Top Fundamental | EPAM | EPAM Systems, Inc. | 46 |
| Top Tech. & Fund. | EPAM | EPAM Systems, Inc. | 46 |
|
Category
|
Symbol
|
Company Name
|
Expected Gain1
|
|---|---|---|---|
| Best Overall | PZE | Petrobras Argentina S.A. | 107 |
| Top Technical | BCRX | BioCryst Pharmaceuticals, Inc. | 71 |
| Top Fundamental | PATK | Patrick Industries, Inc. | 44 |
| Top Tech. & Fund. | PATK | Patrick Industries, Inc. | 44 |
If you received this newsletter from a friend and you would like to receive it regularly please go to the BreakoutWatch.com site and enter as a Guest. You will then be able to register to receive the newsletter.
Copyright © 2014 NBIcharts, LLC dba BreakoutWatch.com. All rights
reserved.
" BreakoutWatch," the BreakoutWatch.com "eye" logo, and the slogan
"tomorrow's breakouts today" are service marks of NBIcharts LLC.
All other marks are the property of their respective owners, and
are used for descriptive purposes only.
BreakoutWatch is not affiliated with Investor's Business Daily or
with Mr. William O'Neil. Our site, research and analysis is
supported entirely by subscription and is free from advertising.