| Market Summary | Weekly Breakout Report | Top Breakout Choices | Top 2nd Chances | New Features | Tip of the Week |
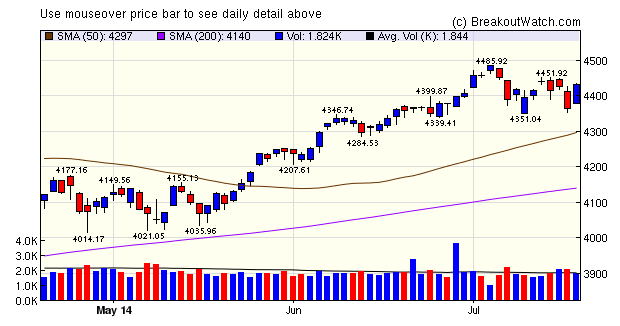
The NASDAQ is consolidating and delivered two accumulation days this week on Monday and Wednesday. The downing of MH17 hit the markets hard on Thursday but Friday's recovery shows that the index still has support.
Two accumulation days this week produced a jump in the number of breakouts to 26 following just 16 last week. The top performer, RUSS, broke out from a head and shoulders bottom, which has been a rare pattern in the recent bull market. Interestingly, RUSS was also in a squeeze but we did not report it as such as the momentum was negative on the day before breakout.
| Breakouts for Week Beginning 07/14/14 | ||||||||
| Brkout Date | Symbol | Base | Squeeze | BrkoutOut Price | Brkout Day Close | Last Close | Current % off BOP | Gain at Intraday High |
|---|---|---|---|---|---|---|---|---|
| 07/17/14 | RUSS | HSB | N | 10.23 | 12.45 | 11.52 | 12.61 | 21.7 |
| 07/14/14 | PEIX | CwH | N | 15.79 | 16.98 | 17.79 | 12.67 | 14.5 |
| 07/16/14 | TSEM | CwH | N | 10.16 | 11.26 | 11.17 | 9.94 | 11.22 |
| 07/14/14 | CBK | CwH | N | 9.04 | 10.03 | 9.29 | 2.77 | 10.95 |
| 07/16/14 | INVE | HTF | N | 11.25 | 11.78 | 11.85 | 5.33 | 6.58 |
| 07/16/14 | BX | SQZ | Y | 33.50 | 33.98 | 35.7 | 6.57 | 6.57 |
| 07/15/14 | BONA | SQZ | Y | 6.72 | 6.9 | 6.78 | 0.89 | 5.65 |
| 07/17/14 | TMF | CwH | N | 61.91 | 64.04 | 63.48 | 2.54 | 3.57 |
| 07/14/14 | HNP | CwH | N | 47.06 | 47.48 | 47.1 | 0.08 | 3.06 |
| 07/18/14 | WOOF | SQZ | Y | 36.71 | 37.26 | 37.26 | 1.50 | 2.72 |
| 07/16/14 | ESC | CwH | N | 33.00 | 33.10 | 33.66 | 2.00 | 2.39 |
| 07/18/14 | ENPH | CwH | N | 9.69 | 9.70 | 9.7 | 0.10 | 2.06 |
| 07/14/14 | MCHX | CwH | N | 12.14 | 12.39 | 11.9 | -1.98 | 2.06 |
| 07/15/14 | BBL | CwH | N | 68.37 | 68.59 | 68.71 | 0.50 | 2.03 |
| 07/17/14 | CF | SQZ | Y | 249.33 | 250.85 | 252.54 | 1.29 | 1.47 |
| 07/18/14 | SKX | SQZ | Y | 47.37 | 47.69 | 47.69 | 0.68 | 1.33 |
| 07/14/14 | ORBC | SQZ | Y | 6.91 | 7 | 6.42 | -7.09 | 1.3 |
| 07/14/14 | QCOR | CwH | N | 95.00 | 96.22 | 95.01 | 0.01 | 1.28 |
| 07/16/14 | CLMT | SQZ | Y | 32.84 | 33.15 | 32.25 | -1.80 | 0.94 |
| 07/18/14 | QGEN | CwH | N | 25.10 | 25.18 | 25.18 | 0.32 | 0.88 |
| 07/18/14 | CF | SQZ | Y | 250.95 | 252.54 | 252.54 | 0.63 | 0.82 |
| 07/16/14 | CIB | SQZ | Y | 60.43 | 60.53 | 60.68 | 0.41 | 0.79 |
| 07/14/14 | PTX | HTF | N | 9.17 | 9.23 | 8.38 | -8.62 | 0.65 |
| 07/16/14 | PUK | CwH | N | 47.49 | 47.76 | 47.04 | -0.95 | 0.57 |
| 07/17/14 | MDCI | HTF | N | 13.80 | 13.83 | 13.83 | 0.22 | 0.29 |
| 07/16/14 | USCR | SQZ | Y | 26.27 | 26.29 | 26.15 | -0.46 | 0.08 |
| Weekly Average (26 breakouts) | 1.54 | 4.06 | ||||||
No new features this week.
The Volatility Edge in Options Trading the Cup with Handle and Squeeze Combination
Those of you who have watched our webinar on options trading the cup and handle with squeeze combination may be interested in a more in-depth analysis of the theory behind why this trading strategy can be successful.
You may know that most options are priced using the Black Scholes model which uses as inputs the current price of the underlying stock, the time to expiry, risk-free interest rate and volatility. For the trading strategy discussed in our webinar, using in-the-money call options, we want the strike price to increase after we have placed our trade. For this to occur we want the underlying price to increase which will increase the volatility which will feed back into the options pricing model thereby raising the strike price and our ability to sell our call option at a profit.
The value in combining the cup with handle pattern and the squeeze is that:
- we know that a breakout from a CwH pattern is successful about 60% of the time since 2008 (see newsletter 3/15/14) - more in a bull market. This gives us a favorable probability that the underlying price will rise
- a squeeze situation ensures that the stock is at a historical volatility low so the volatility is highly likely to increase as the underlying price increases.
The combination of rising price and increasing volatility combined with the leverage inherent in options trading makes this trading strategy attractive.
Before entering a trade, a further factor to consider is whether or not the option is fairly priced. This will depend on the volatility implied by the strike price as compared to the true volatility at the time. At this time, our charts combining the Bollinger Band (BB) and Keltner Channel show the volatility as measured by the two standard deviation BB. It should be understood that this is not the volatility implied by putting the strike price (and other variables) into the Black Scholes model and cannot be used to determine if the option is fairly priced. We may add the true volatility to the charts in the near future to allow this comparison to be made.
I am grateful to a reader for directing my attention to The Volatility Edge in Options Trading by Jeff Augen which examines these considerations in great depth. The Wikipedia article on Volatility and Volatility Arbitrage are also very helpful.
| Index | Value | Change Week | Change YTD | Trend | ||||||||||||||||||||||||||||||||||||
|---|---|---|---|---|---|---|---|---|---|---|---|---|---|---|---|---|---|---|---|---|---|---|---|---|---|---|---|---|---|---|---|---|---|---|---|---|---|---|---|---|
| Dow | 17100.2 | 0.92% | 3.16% | Up | ||||||||||||||||||||||||||||||||||||
| NASDAQ | 4432.15 | 0.38% | 6.12% | Up | ||||||||||||||||||||||||||||||||||||
| S&P 500 | 1978.22 | 0.54% | 7.03% | Up | ||||||||||||||||||||||||||||||||||||
1The Market Signal is derived
from our proprietary market model. The market model is
described on the site.
2The site also shows industry rankings based on fundamentals, combined technical and fundamentals, and on price alone. The site also shows daily industry movements. |
||||||||||||||||||||||||||||||||||||||||
|
Category
|
Symbol
|
Company Name
|
Expected Gain1
|
|---|---|---|---|
| Best Overall | PZE | Petrobras Argentina S.A. | 110 |
| Top Technical | PZE | Petrobras Argentina S.A. | 110 |
| Top Fundamental | PFMT | Performant Financial Corporation | 51 |
| Top Tech. & Fund. | PFMT | Performant Financial Corporation | 51 |
|
Category
|
Symbol
|
Company Name
|
Expected Gain1
|
|---|---|---|---|
| Best Overall | ENPH | Enphase Energy, Inc. | 91 |
| Top Technical | CBK | Christopher & Banks Corporation | 77 |
| Top Fundamental | QCOR | Questcor Pharmaceuticals, Inc. | 36 |
| Top Tech. & Fund. | QCOR | Questcor Pharmaceuticals, Inc. | 36 |
If you received this newsletter from a friend and you would like to receive it regularly please go to the BreakoutWatch.com site and enter as a Guest. You will then be able to register to receive the newsletter.
Copyright © 2014 NBIcharts, LLC dba BreakoutWatch.com. All rights
reserved.
" BreakoutWatch," the BreakoutWatch.com "eye" logo, and the slogan
"tomorrow's breakouts today" are service marks of NBIcharts LLC.
All other marks are the property of their respective owners, and
are used for descriptive purposes only.
BreakoutWatch is not affiliated with Investor's Business Daily or
with Mr. William O'Neil. Our site, research and analysis is
supported entirely by subscription and is free from advertising.