| Market Summary | Weekly Breakout Report | Top Breakout Choices | Top 2nd Chances | New Features | Tip of the Week |
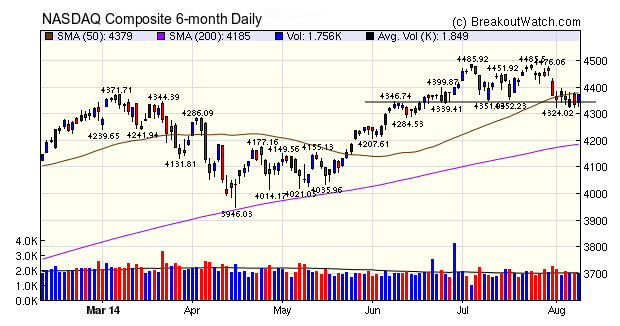
The NASDAQ Composite is trading between support at 4324 and resistance at the 50 dma level of 4380. At first glance, it appears that the index has formed a bearish double top pattern, and this would certainly be consistent with our trend indicator which is pointing down for all three major indexes. However, the index has not breached support consistently, so the jury is out as to the future direction. There is reason for optimism though, as the index closed with a gain for the week, despite there being two distribution days.
There
will be no newsletter next week as I will be returning to Maui
from Sydney.
The positive weekly gain for the NASDAQ produced a 50% jump in breakouts from 16 last week to 25 this week. Note that the three best intraday performers were from our SqueezePlay watchlist. SqueezePlay breakouts tend to perform better in the first few days after breakout. More on this below.
| Breakouts for Week Beginning 08/04/14 | ||||||||
| Brkout Date | Symbol | Base | Squeeze | BrkoutOut Price | Brkout Day Close | Last Close | Current % off BOP | Gain at Intraday High |
|---|---|---|---|---|---|---|---|---|
| 08/07/14 | LEAF | SQZ | Y | 27.36 | 29.65 | 32.88 | 20.18 | 20.18 |
| 08/05/14 | QLYS | SQZ | Y | 26.44 | 29.09 | 26.54 | 0.38 | 10.02 |
| 08/04/14 | TSLA | SQZ | Y | 233.37 | 238.52 | 248.13 | 6.32 | 8.15 |
| 08/06/14 | TIBX | HSB | N | 19.62 | 20.75 | 21.08 | 7.44 | 7.44 |
| 08/04/14 | BCRX | CwH | N | 13.02 | 13.22 | 13.96 | 7.22 | 7.22 |
| 08/05/14 | NLS | SQZ | Y | 11.12 | 11.58 | 11.91 | 7.10 | 7.1 |
| 08/06/14 | WNR | CwH | N | 42.64 | 43.66 | 44.93 | 5.37 | 5.37 |
| 08/08/14 | BCRX | CwH | N | 13.34 | 13.96 | 13.96 | 4.65 | 4.65 |
| 08/05/14 | RARE | SQZ | Y | 47.95 | 48.5 | 49.49 | 3.21 | 4.28 |
| 08/05/14 | IART | SQZ | Y | 48.22 | 50.01 | 48.65 | 0.89 | 3.71 |
| 08/04/14 | VSI | HSB | N | 42.23 | 43.60 | 37.55 | -11.08 | 3.24 |
| 08/05/14 | SNCR | CwH | N | 40.68 | 41.98 | 38.3 | -5.85 | 3.2 |
| 08/08/14 | MDVN | CwH | N | 78.44 | 80.93 | 80.93 | 3.17 | 3.17 |
| 08/05/14 | DECK | CwH | N | 90.76 | 91.71 | 93.47 | 2.99 | 2.99 |
| 08/07/14 | FSLR | SQZ | Y | 66.40 | 68.17 | 67.83 | 2.15 | 2.67 |
| 08/06/14 | KEP | CwH | N | 20.89 | 21.09 | 21.36 | 2.25 | 2.25 |
| 08/07/14 | SCTY | CwH | N | 74.29 | 75.63 | 70.14 | -5.59 | 1.8 |
| 08/04/14 | MKSI | CwH | N | 32.04 | 32.19 | 32.44 | 1.25 | 1.5 |
| 08/07/14 | VGR | SQZ | Y | 21.28 | 21.5 | 21.5 | 1.03 | 1.03 |
| 08/07/14 | FDP | SQZ | Y | 30.79 | 30.79 | 31.03 | 0.78 | 0.78 |
| 08/08/14 | RUSHA | CwH | N | 35.85 | 36.04 | 36.04 | 0.53 | 0.53 |
| 08/06/14 | EPAM | SQZ | Y | 40.87 | 40.9 | 40.72 | -0.37 | 0.51 |
| 08/08/14 | FDP | SQZ | Y | 30.89 | 31.03 | 31.03 | 0.45 | 0.45 |
| 08/05/14 | SNSS | CwH | N | 7.00 | 7.01 | 6.7 | -4.29 | 0.14 |
| 08/07/14 | TMF | CwH | N | 65.66 | 65.75 | 65.44 | -0.34 | 0.14 |
| Weekly Average (25 breakouts) | 1.99 | 4.1 | ||||||
No new features this week.
SqueezePlay Breakouts Compared to CWH Breakouts
The SqueezePlay (SQZ) watchlist selects stocks in a squeeze that are lower in their base than the Cup with Handle (CwH) watchlist. Since, in theory, the SQZ stocks have more potential to move higher, the question arises as to which breakouts perform better. I was interested in both a short term and longer term comparison.
For this exercise, I compared SQZ stock breakouts since March, when we introduced the SQZ list, to CWH breakouts for the same period. This gave me 19 weeks of data. I was interested in both a short term and longer term comparison, so I compared the performance in the first few days after breakout to the full 19 weeks.
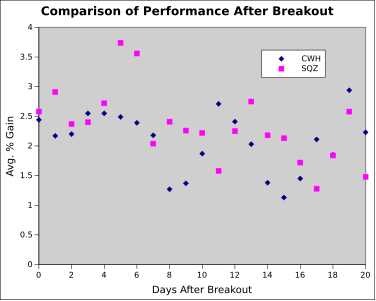
The first chart shows the performance over the first 20 days, including the breakout day (Day 0). The data is derived from the average gain made by day after breakout. It is apparent that SQZ breakouts tend to perform better in the first 6 days after breakout but that there is little difference in subsequent days.
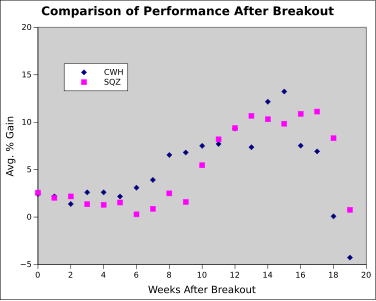
The next chart shows the
performance over the whole 19 weeks, including the breakout
day (Day 0). The data is derived from the average gain 0, 7,
14, etc days after breakout. We see the SQZ performance is
better in the first 2 weeks and that thereafter the CWH
breakouts perform better. Note that the longer time frames
include the recent correction and that in this period the SQZ
stocks perform better.
Conclusion
The time period under analysis is too short to provide a definitive answer but it seems that SqueezePlay breakouts perform better in the short term. If you are a swing trader, therefore, trading SqueezePlay breakouts may prove more profitable for you. If your time horizon is longer, then cup with handle breakouts will prove slightly more profitable for you.
The time period under analysis is too short to provide a definitive answer but it seems that SqueezePlay breakouts perform better in the short term. If you are a swing trader, therefore, trading SqueezePlay breakouts may prove more profitable for you. If your time horizon is longer, then cup with handle breakouts will prove slightly more profitable for you.
| Index | Value | Change Week | Change YTD | Trend | ||||||||||||||||||||||||||||||||||||
|---|---|---|---|---|---|---|---|---|---|---|---|---|---|---|---|---|---|---|---|---|---|---|---|---|---|---|---|---|---|---|---|---|---|---|---|---|---|---|---|---|
| Dow | 16553.9 | 0.37% | -0.14% | Down | ||||||||||||||||||||||||||||||||||||
| NASDAQ | 4370.9 | 0.42% | 4.65% | Down | ||||||||||||||||||||||||||||||||||||
| S&P 500 | 1931.59 | 0.33% | 4.5% | Down | ||||||||||||||||||||||||||||||||||||
1The Market Signal is derived
from our proprietary market model. The market model is
described on the site.
2The site also shows industry rankings based on fundamentals, combined technical and fundamentals, and on price alone. The site also shows daily industry movements. |
||||||||||||||||||||||||||||||||||||||||
|
Category
|
Symbol
|
Company Name
|
Expected Gain1
|
|---|---|---|---|
| Best Overall | PZE | Petrobras Argentina S.A. | 102 |
| Top Technical | PZE | Petrobras Argentina S.A. | 102 |
| Top Fundamental | BIIB | Biogen Idec Inc. | 27 |
| Top Tech. & Fund. | FB | Facebook, Inc. | 37 |
|
Category
|
Symbol
|
Company Name
|
Expected Gain1
|
|---|---|---|---|
| Best Overall | SNSS | Sunesis Pharmaceuticals, Inc. | 91 |
| Top Technical | BCRX | BioCryst Pharmaceuticals, Inc. | 62 |
| Top Fundamental | SNCR | Synchronoss Technologies, Inc. | 36 |
| Top Tech. & Fund. | SNCR | Synchronoss Technologies, Inc. | 36 |
If you received this newsletter from a friend and you would like to receive it regularly please go to the BreakoutWatch.com site and enter as a Guest. You will then be able to register to receive the newsletter.
Copyright © 2014 NBIcharts, LLC dba BreakoutWatch.com. All rights
reserved.
" BreakoutWatch," the BreakoutWatch.com "eye" logo, and the slogan
"tomorrow's breakouts today" are service marks of NBIcharts LLC.
All other marks are the property of their respective owners, and
are used for descriptive purposes only.
BreakoutWatch is not affiliated with Investor's Business Daily or
with Mr. William O'Neil. Our site, research and analysis is
supported entirely by subscription and is free from advertising.