| Market Summary | Weekly Breakout Report | Top Breakout Choices | Top 2nd Chances | New Features | Tip of the Week |
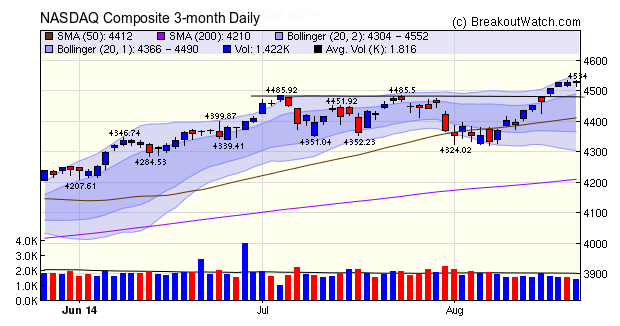
I'm back from my travels and pleased that the last two weeks have seen a strong recovery for the NASDAQ Composite. Volume has been below average but that is typical for August so it is not indicative of a weak recovery. On the contrary, the index burst through resistance on Tuesday and closed near its high for the week on Friday. The index is close to the top of the two standard deviation Bollinger Band so we may see a few days of consolidation from here.
Low volumes contributed to there being a drop in the number of confirmed breakouts this week. This is because our standard for a confirmed breakout is that the volume on breakout day must be at least 150% of the 50 day average volume. With volume being generally lower even strong breakouts on price could not meet the volume standard.
| Breakouts for Week Beginning 08/18/14 | ||||||||
| Brkout Date | Symbol | Base | Squeeze | BrkoutOut Price | Brkout Day Close | Last Close | Current % off BOP | Gain at Intraday High |
|---|---|---|---|---|---|---|---|---|
| 08/18/14 | NEWM | CwH | N | 15.47 | 16.45 | 16.18 | 4.59 | 8.4 |
| 08/18/14 | MSG | SQZ | Y | 61.33 | 62.72 | 63.63 | 3.75 | 5.98 |
| 08/18/14 | BLT | CwH | N | 15.09 | 15.39 | 15.81 | 4.77 | 5.63 |
| 08/19/14 | FFIV | SQZ | Y | 116.67 | 120.02 | 122.09 | 4.65 | 5.06 |
| 08/21/14 | BSTC | CwH | N | 29.55 | 30.92 | 30.92 | 4.64 | 4.64 |
| 08/20/14 | WNRL | DB | N | 33.40 | 34.87 | 34.92 | 4.55 | 4.55 |
| 08/19/14 | CTRN | SQZ | Y | 21.31 | 21.53 | 22.13 | 3.85 | 3.85 |
| 08/18/14 | FDO | CwH | N | 77.25 | 79.81 | 79.41 | 2.80 | 3.31 |
| 08/19/14 | RDI | CwH | N | 8.62 | 8.84 | 8.71 | 1.04 | 2.55 |
| 08/19/14 | TUES | SQZ | Y | 17.79 | 17.8 | 17.09 | -3.93 | 0.11 |
| Weekly Average (10 breakouts) | 3.07 | 4.41 | ||||||
An alert subscriber spotted an anomaly in the transaction record produced from the CWH Backtest tool where the volume for a breakout was incorrectly recorded. The anomaly arose from the difficulty of adjusting the historical price and volume for splits and dividends. The method of maintaining the data source for the backtest has now been rewritten as a consequence and I believe we shouldn't have this problem again. Of course, I'm always grateful when these these errors are pointed out so I can improve the quality of my service.
The CWH backtest data should now be correct back to 2009.
Not really a tip, but an explanation of how our data is maintained.
As you know, splits and dividends cause sudden price changes. For example, a 2 for 1 split immediately increases the number of tradeable shares by a factor of 2 and the price is immediately cut in two. These sudden changes in price would make pattern recognition impossible unless the historical data were adjusted so the historical prices were made consistent with the new volume of tradeable shares. So in this example, we divide all historical prices by 2 and multiply all volumes by two. This gives a smooth time series with discontinuities in price and volume. Dividends create discontinuities also, and so we adjust for these as well.
When we are aware of a split or dividend during the week, we apply an adjustment accordingly. However, to ensure we don't miss anything, we rebuild our historical database for the last 5 years every weekend.
While these adjustments are relatively simple to apply to our historical time series, it is more complicated to apply the adjustments to now 11 years of watchlist data
| Index | Value | Change Week | Change YTD | Trend | ||||||||||||||||||||||||||||||||||||
|---|---|---|---|---|---|---|---|---|---|---|---|---|---|---|---|---|---|---|---|---|---|---|---|---|---|---|---|---|---|---|---|---|---|---|---|---|---|---|---|---|
| Dow | 17039.5 | 2.26% | 2.79% | Up | ||||||||||||||||||||||||||||||||||||
| NASDAQ | 4532.1 | 1.5% | 8.51% | Up | ||||||||||||||||||||||||||||||||||||
| S&P 500 | 1992.37 | 1.91% | 7.79% | Up | ||||||||||||||||||||||||||||||||||||
1The Market Signal is derived
from our proprietary market model. The market model is
described on the site.
2The site also shows industry rankings based on fundamentals, combined technical and fundamentals, and on price alone. The site also shows daily industry movements. |
||||||||||||||||||||||||||||||||||||||||
|
Category
|
Symbol
|
Company Name
|
Expected Gain1
|
|---|---|---|---|
| Best Overall | RDNT | RadNet, Inc. | 114 |
| Top Technical | RDNT | RadNet, Inc. | 114 |
| Top Fundamental | ATHM | Autohome Inc. | 44 |
| Top Tech. & Fund. | ATHM | Autohome Inc. | 44 |
|
Category
|
Symbol
|
Company Name
|
Expected Gain1
|
|---|---|---|---|
| Best Overall | RDI | Reading International Inc | 75 |
| Top Technical | FDO | Family Dollar Stores, Inc. | 27 |
| Top Fundamental | NEWM | New Media Investment Group Inc. | 49 |
| Top Tech. & Fund. | NEWM | New Media Investment Group Inc. | 49 |
If you received this newsletter from a friend and you would like to receive it regularly please go to the BreakoutWatch.com site and enter as a Guest. You will then be able to register to receive the newsletter.
Copyright © 2014 NBIcharts, LLC dba BreakoutWatch.com. All rights
reserved.
" BreakoutWatch," the BreakoutWatch.com "eye" logo, and the slogan
"tomorrow's breakouts today" are service marks of NBIcharts LLC.
All other marks are the property of their respective owners, and
are used for descriptive purposes only.
BreakoutWatch is not affiliated with Investor's Business Daily or
with Mr. William O'Neil. Our site, research and analysis is
supported entirely by subscription and is free from advertising.