| Market Summary | Weekly Breakout Report | Top Breakout Choices | Top 2nd Chances | New Features | Tip of the Week |
I still have limited use of
my right arm but only 3 weeks to go before things should improve.
The newsletter will remain very brief during this period.
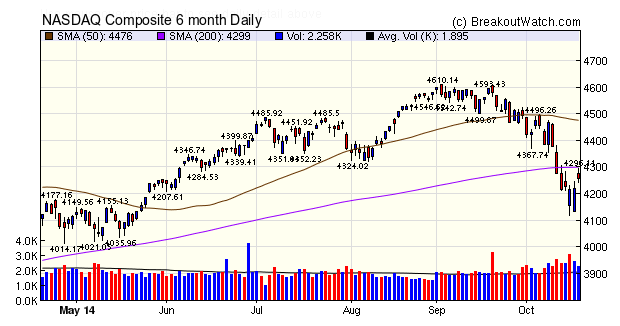
Thursday saw a possible trend reversal as the NASDAQ closed well above its intraday low on above average volume. This produced a gap up on Friday but the index met resistance at its 200 dma level and ultimately closed for a slight loss on the day. Friday's volume, although above average, was disappointing compared to Thursday's so the possible trend reversal remains in doubt.
Thursday saw a possible trend reversal as the NASDAQ closed well above its intraday low on above average volume. This produced a gap up on Friday but the index met resistance at its 200 dma level and ultimately closed for a slight loss on the day. Friday's volume, although above average, was disappointing compared to Thursday's so the possible trend reversal remains in doubt.
Despite the downtrend, there were a surprising number of breakouts this week, although mostly from the SqueezePlay watchlist, which also delivered the two top performers.
| Breakouts for Week Beginning 10/13/14 | ||||||||
| Brkout Date | Symbol | Base | Squeeze | BrkoutOut Price | Brkout Day Close | Last Close | Current % off BOP | Gain at Intraday High |
|---|---|---|---|---|---|---|---|---|
| 10/14/14 | RNA | SQZ | Y | 9.67 | 10.51 | 11.35 | 17.37 | 17.37 |
| 10/14/14 | MDXG | SQZ | Y | 7.74 | 7.94 | 8.29 | 7.11 | 13.7 |
| 10/14/14 | DPZ | CwH | N | 77.92 | 84.30 | 84.84 | 8.88 | 8.88 |
| 10/15/14 | EPV | CwH | N | 67.65 | 68.78 | 67.07 | -0.86 | 7.39 |
| 10/15/14 | STRA | SQZ | Y | 61.65 | 62.79 | 64.15 | 4.06 | 4.06 |
| 10/17/14 | RDN | SQZ | Y | 15.09 | 15.42 | 15.42 | 2.19 | 2.19 |
| 10/16/14 | NBIX | SQZ | Y | 16.98 | 17.35 | 16.32 | -3.89 | 2.18 |
| 10/17/14 | LDRH | SQZ | Y | 32.61 | 33.3 | 33.3 | 2.12 | 2.12 |
| 10/15/14 | MMD | CwH | N | 18.05 | 18.06 | 18.41 | 1.99 | 1.99 |
| 10/17/14 | AFH | SQZ | Y | 14.60 | 14.88 | 14.88 | 1.92 | 1.92 |
| 10/14/14 | ETR | CwH | N | 79.62 | 81.04 | 79.33 | -0.36 | 1.78 |
| 10/14/14 | DFT | SQZ | Y | 27.88 | 27.99 | 28.36 | 1.72 | 1.72 |
| 10/13/14 | NJR | SQZ | Y | 52.09 | 52.22 | 52.79 | 1.34 | 1.71 |
| 10/14/14 | PEBO | SQZ | Y | 24.72 | 24.98 | 24.83 | 0.44 | 1.7 |
| 10/16/14 | FXCM | SQZ | Y | 16.61 | 16.85 | 16.87 | 1.57 | 1.57 |
| 10/15/14 | NPI | CwH | N | 13.62 | 13.62 | 13.82 | 1.47 | 1.47 |
| 10/14/14 | PEG | SQZ | Y | 38.15 | 38.69 | 37.5 | -1.70 | 1.42 |
| 10/15/14 | SYNT | SQZ | Y | 89.35 | 90.57 | 81.95 | -8.28 | 1.37 |
| 10/14/14 | NJR | SQZ | Y | 52.32 | 52.98 | 52.79 | 0.90 | 1.26 |
| 10/14/14 | WSBC | SQZ | Y | 31.60 | 31.66 | 31.97 | 1.17 | 1.17 |
| 10/15/14 | CBOE | CwH | N | 55.90 | 56.45 | 54.34 | -2.79 | 0.98 |
| 10/17/14 | CRAI | SQZ | Y | 26.36 | 26.48 | 26.48 | 0.46 | 0.46 |
| 10/17/14 | NXZ | CwH | N | 14.12 | 14.17 | 14.17 | 0.35 | 0.35 |
| 10/15/14 | BBN | CwH | N | 21.57 | 21.59 | 21.38 | -0.88 | 0.09 |
| 10/17/14 | REGN | CwH | N | 369.31 | 369.64 | 369.64 | 0.09 | 0.09 |
| 10/14/14 | REV | SQZ | Y | 32.77 | 32.79 | 32.13 | -1.95 | 0.06 |
| 10/17/14 | WY | SQZ | Y | 32.99 | 32.99 | 32.99 | 0.00 | 0 |
| Weekly Average (27 breakouts) | 1.28 | 2.93 | ||||||
No new features this week.
Nothing to add this week.
| Index | Value | Change Week | Change YTD | Trend | ||||||||||||||||||||||||||||||||||||
|---|---|---|---|---|---|---|---|---|---|---|---|---|---|---|---|---|---|---|---|---|---|---|---|---|---|---|---|---|---|---|---|---|---|---|---|---|---|---|---|---|
| Dow | 16380.4 | -0.99% | -1.18% | Down | ||||||||||||||||||||||||||||||||||||
| NASDAQ | 4258.44 | -0.42% | 1.96% | Down | ||||||||||||||||||||||||||||||||||||
| S&P 500 | 1886.76 | -1.02% | 2.08% | Down | ||||||||||||||||||||||||||||||||||||
1The Market Signal is derived
from our proprietary market model. The market model is
described on the site.
2The site also shows industry rankings based on fundamentals, combined technical and fundamentals, and on price alone. The site also shows daily industry movements. |
||||||||||||||||||||||||||||||||||||||||
|
Category
|
Symbol
|
Company Name
|
Expected Gain1
|
|---|---|---|---|
| Best Overall | CRME | Cardiome Pharma Corporation | 83 |
| Top Technical | CRME | Cardiome Pharma Corporation | 83 |
| Top Fundamental | SXI | Standex International Corporation | 24 |
| Top Tech. & Fund. | SXI | Standex International Corporation | 24 |
|
Category
|
Symbol
|
Company Name
|
Expected Gain1
|
|---|---|---|---|
| Best Overall | NPI | Nuveen Premium Income Municipal Fund, Inc. | 41 |
| Top Technical | EPV | ENDO HEALTH SOL.INC.DL-01 | 22 |
| Top Fundamental | REGN | Regeneron Pharmaceuticals, Inc. | 0 |
| Top Tech. & Fund. | REGN | Regeneron Pharmaceuticals, Inc. | 0 |
If you received this newsletter from a friend and you would like to receive it regularly please go to the BreakoutWatch.com site and enter as a Guest. You will then be able to register to receive the newsletter.
Copyright © 2014 NBIcharts, LLC dba BreakoutWatch.com. All rights
reserved.
" BreakoutWatch," the BreakoutWatch.com "eye" logo, and the slogan
"tomorrow's breakouts today" are service marks of NBIcharts LLC.
All other marks are the property of their respective owners, and
are used for descriptive purposes only.
BreakoutWatch is not affiliated with Investor's Business Daily or
with Mr. William O'Neil. Our site, research and analysis is
supported entirely by subscription and is free from advertising.