| Market Summary | Weekly Breakout Report | Top Breakout Choices | Top 2nd Chances | New Features | Tip of the Week |
Right arm still immobile so newsletter still somewhat cursory.
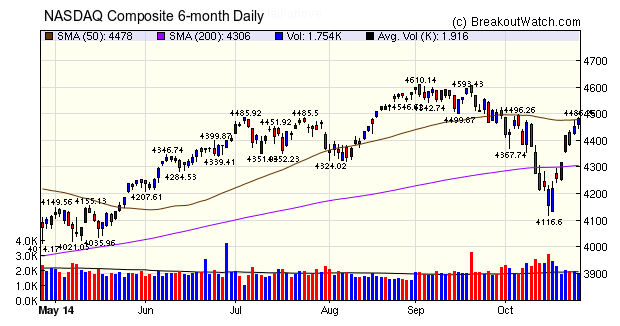
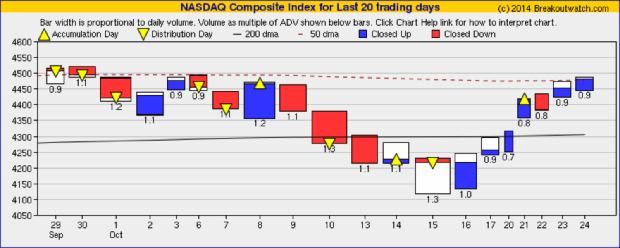
The NASDAQ bounced strongly off the bottom and closed just above the 50 day moving average on Friday. Nevertheless, our trend indicator for the three major indices still points down. The reason is shown clearly in our equivolume chart (2nd chart below) where the volume levels are clearly well below average. Any recovery on low volume is suspect.
| Breakouts for Week Beginning 10/20/14 | ||||||||
| Brkout Date | Symbol | Base | Squeeze | BrkoutOut Price | Brkout Day Close | Last Close | Current % off BOP | Gain at Intraday High |
|---|---|---|---|---|---|---|---|---|
| 10/24/14 | BJRI | CwH | N | 37.77 | 42.15 | 42.15 | 11.60 | 11.6 |
| 10/20/14 | ORLY | SQZ | Y | 153.79 | 154.96 | 170.48 | 10.85 | 10.85 |
| 10/22/14 | CBST | HSB | N | 67.00 | 69.15 | 70.93 | 5.87 | 8.09 |
| 10/22/14 | IBP | SQZ | Y | 14.60 | 14.75 | 15.09 | 3.36 | 7.81 |
| 10/20/14 | CPHD | SQZ | Y | 46.55 | 46.56 | 50.08 | 7.58 | 7.58 |
| 10/20/14 | NXTM | SQZ | Y | 13.91 | 14.04 | 14.79 | 6.33 | 6.33 |
| 10/20/14 | TSO | DB | N | 64.60 | 65.43 | 65.68 | 1.67 | 3.79 |
| 10/23/14 | BCR | CwH | N | 151.49 | 154.23 | 156.97 | 3.62 | 3.62 |
| 10/24/14 | PTX | CwH | N | 9.59 | 9.87 | 9.87 | 2.92 | 2.92 |
| 10/23/14 | EPAM | CwH | N | 43.90 | 45.10 | 44.36 | 1.05 | 2.73 |
| 10/20/14 | EDR | CwH | N | 10.87 | 11.01 | 11.12 | 2.30 | 2.67 |
| 10/22/14 | MCY | SQZ | Y | 50.60 | 50.9 | 51.6 | 1.98 | 1.98 |
| 10/21/14 | TTM | DB | N | 45.00 | 45.88 | 45.59 | 1.31 | 1.96 |
| 10/21/14 | FXU | SQZ | Y | 23.16 | 23.27 | 23.56 | 1.73 | 1.73 |
| 10/20/14 | DNP | SQZ | Y | 10.31 | 10.34 | 10.48 | 1.65 | 1.65 |
| 10/20/14 | SVVC | CwH | N | 24.63 | 24.63 | 25.03 | 1.62 | 1.62 |
| 10/21/14 | DPM | SQZ | Y | 54.32 | 54.8 | 55.07 | 1.38 | 1.38 |
| 10/21/14 | ISRG | CwH | N | 489.85 | 495.77 | 478.01 | -2.42 | 1.21 |
| Weekly Average (18 breakouts) | 3.58 | 4.42 | ||||||
No new features this week.
| Index | Value | Change Week | Change YTD | Trend | ||||||||||||||||||||||||||||||||||||
|---|---|---|---|---|---|---|---|---|---|---|---|---|---|---|---|---|---|---|---|---|---|---|---|---|---|---|---|---|---|---|---|---|---|---|---|---|---|---|---|---|
| Dow | 16805.4 | 2.59% | 1.38% | Down | ||||||||||||||||||||||||||||||||||||
| NASDAQ | 4483.71 | 5.29% | 7.35% | Down | ||||||||||||||||||||||||||||||||||||
| S&P 500 | 1964.58 | 4.12% | 6.29% | Down | ||||||||||||||||||||||||||||||||||||
1The Market Signal is derived
from our proprietary market model. The market model is
described on the site.
2The site also shows industry rankings based on fundamentals, combined technical and fundamentals, and on price alone. The site also shows daily industry movements. |
||||||||||||||||||||||||||||||||||||||||
|
Category
|
Symbol
|
Company Name
|
Expected Gain1
|
|---|---|---|---|
| Best Overall | PTX | Pernix Therapeutics Holdings, Inc. | 76 |
| Top Technical | PTX | Pernix Therapeutics Holdings, Inc. | 76 |
| Top Fundamental | AFH | Atlas Financial Holdings, Inc. | 38 |
| Top Tech. & Fund. | AFH | Atlas Financial Holdings, Inc. | 38 |
|
Category
|
Symbol
|
Company Name
|
Expected Gain1
|
|---|---|---|---|
| Best Overall | PTX | Pernix Therapeutics Holdings, Inc. | 74 |
| Top Technical | PTX | Pernix Therapeutics Holdings, Inc. | 74 |
| Top Fundamental | EPAM | EPAM Systems, Inc. | 34 |
| Top Tech. & Fund. | EPAM | EPAM Systems, Inc. | 34 |
If you received this newsletter from a friend and you would like to receive it regularly please go to the BreakoutWatch.com site and enter as a Guest. You will then be able to register to receive the newsletter.
Copyright © 2014 NBIcharts, LLC dba BreakoutWatch.com. All rights
reserved.
" BreakoutWatch," the BreakoutWatch.com "eye" logo, and the slogan
"tomorrow's breakouts today" are service marks of NBIcharts LLC.
All other marks are the property of their respective owners, and
are used for descriptive purposes only.
BreakoutWatch is not affiliated with Investor's Business Daily or
with Mr. William O'Neil. Our site, research and analysis is
supported entirely by subscription and is free from advertising.