| Market Summary | Weekly Breakout Report | Top Breakout Choices | Top 2nd Chances | New Features | Tip of the Week |
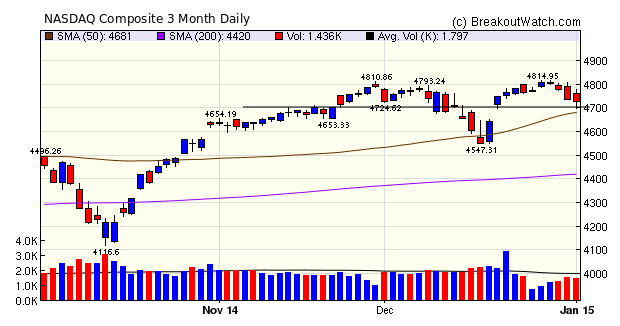
Low volume, profit taking and end of tax year portfolio rebalancing depressed the markets in the final days of the year but the NASDAQ bounced off the 4700 support level to close above its intraday low on Friday.
Low volumes and the 4 day trading week again kept the number of breakouts to a minimum. The recent market gains have created conditions for a more than usual number of High Tight Flag patterns and two HTF breakouts led the leader board this week. More on the HTF pattern below.
| Breakouts for Week Beginning 12/29/14 | ||||||||
| Brkout Date | Symbol | Base | Squeeze | BrkoutOut Price | Brkout Day Close | Last Close | Current % off BOP | Gain at Intraday High |
|---|---|---|---|---|---|---|---|---|
| 12/29/14 | OMER | HTF | N | 23.46 | 23.91 | 25.01 | 6.61 | 6.99 |
| 12/29/14 | SCO | HTF | N | 75.18 | 77.10 | 79.9 | 6.28 | 6.73 |
| 12/30/14 | ADES | HSB | N | 22.15 | 23.03 | 21.86 | -1.31 | 6.37 |
| 12/31/14 | SSNI | HSB | N | 8.05 | 8.43 | 8.09 | 0.50 | 5.96 |
| 12/31/14 | ATRC | CwH | N | 19.41 | 19.96 | 19.78 | 1.91 | 3.5 |
| Weekly Average (5 breakouts) | 2.8 | 5.91 | ||||||
High Tight Flag Pattern Rare but Profitable
In How to Make Money in Stocks, William J. O'Neil identified the High, Tight Flag pattern as rare but potentially highly profitable. In his Encyclopedia of Chart Patterns, (John Wiley and Sons, 2000) Thomas Bulkowski found they were not so rare but also very profitable, provided you waited for the breakout to enter the trade. We developed an algorithm to recognize the pattern and introduced it in 2007. At that time we looked at the performance of the pattern during 2007 and and found that it was rare in comparison to the cup-with-handle (CwH) but still found quite often. (see Newsletter for 12/29/07).
| Summary of High Tight Flag Patterns for 2007 | All | >= $6 | < $6 |
|---|---|---|---|
| No.of Distinct HTF Patterns Recognized | 165 | 105 | 60 |
| No. of Breakouts | 53 | 37 | 16 |
| Average gain to Max. High after breakout | 73% | 50% | 126% |
| Average Drawdown before Max. High after breakout | 6.43% | 4.48% | 7.28% |
The pattern is rare because of the conditions necessary to create it - few stocks have gains of 100% or more in eight weeks or less, but that is one of the requirements for the pattern to form. This requirement mandates that a stock that qualifies as an HTF will have a very high relative strength - in the high 90's. Our research has shown that stocks with a high Relative Strength Rank, perform well after breakout.
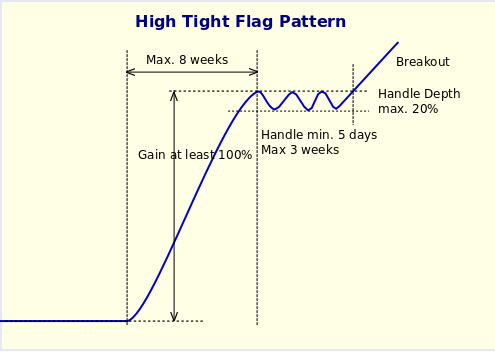
Our algorithm looks for stocks that meet the following criteria:
- they must have formed a handle within the last 3 weeks of trading
- the handle must be at least 5 days long
- the decline in the handle must be no more than 20%
- there must have been a gain of at least 100% in the eight weeks prior to the handle formation
- there is no minimum price or volume requirement
Some definitions of the High Tight Flag require that the stock be moving sideways before the rise and that volume be declining in the handle (like the CwH). We have not incorporated those criteria in the algorithm.
Eight HTF Stocks to Watch
Our HTF watchlist currently lists eight stocks.
| Symbol |
Industry
Group |
Industry
Rank |
RS
Rank |
Last
Close |
Breakout
Price |
|---|---|---|---|---|---|
| OVAS | Biotechnology | 179 | 99 | 45.83 | 47.85 |
| PSQ | Closed-End Fund - Equity | 88 | 99 | 59.63 | 61.72 |
| RCPT | Biotechnology | 179 | 99 | 124.81 | 136.43 |
| SKF | Closed-End Fund - Equity | 88 | 99 | 50.08 | 55.28 |
| VIXM | Closed-End Fund - Equity | 88 | 99 | 63.37 | 67.99 |
| LJPC | Biotechnology | 179 | 98 | 17.94 | 20.15 |
| MTEX | Personal Products | 145 | 98 | 25.16 | 29.05 |
| MGNX | Biotechnology | 179 | 97 | 35.18 | 38.58 |
| Index | Value | Change Week | Change YTD | Trend | ||||||||||||||||||||||||||||||||||||
|---|---|---|---|---|---|---|---|---|---|---|---|---|---|---|---|---|---|---|---|---|---|---|---|---|---|---|---|---|---|---|---|---|---|---|---|---|---|---|---|---|
| Dow | 17833 | -1.22% | 0.06% | Up | ||||||||||||||||||||||||||||||||||||
| NASDAQ | 4726.81 | -1.67% | -0.2% | Up | ||||||||||||||||||||||||||||||||||||
| S&P 500 | 2058.2 | -1.46% | -0.03% | Up | ||||||||||||||||||||||||||||||||||||
1The Market Signal is derived
from our proprietary market model. The market model is
described on the site.
2The site also shows industry rankings based on fundamentals, combined technical and fundamentals, and on price alone. The site also shows daily industry movements. |
||||||||||||||||||||||||||||||||||||||||
|
Category
|
Symbol
|
Company Name
|
Expected Gain1
|
|---|---|---|---|
| Best Overall | OREX | Orexigen Therapeutics, Inc. | 119 |
| Top Technical | OREX | Orexigen Therapeutics, Inc. | 119 |
| Top Fundamental | NOAH | Noah Holdings Ltd. | 53 |
| Top Tech. & Fund. | RAX | Rackspace Hosting, Inc | 28 |
|
Category
|
Symbol
|
Company Name
|
Expected Gain1
|
|---|---|---|---|
| Best Overall | ATRC | AtriCure, Inc. | 58 |
| Top Technical | ATRC | AtriCure, Inc. | 58 |
| Top Fundamental | ATRC | AtriCure, Inc. | 58 |
| Top Tech. & Fund. | ATRC | AtriCure, Inc. | 58 |
If you received this newsletter from a friend and you would like to receive it regularly please go to the BreakoutWatch.com site and enter as a Guest. You will then be able to register to receive the newsletter.
Copyright © 2015 NBIcharts, LLC dba BreakoutWatch.com. All rights
reserved.
" BreakoutWatch," the BreakoutWatch.com "eye" logo, and the slogan
"tomorrow's breakouts today" are service marks of NBIcharts LLC.
All other marks are the property of their respective owners, and
are used for descriptive purposes only.
BreakoutWatch is not affiliated with Investor's Business Daily or
with Mr. William O'Neil. Our site, research and analysis is
supported entirely by subscription and is free from advertising.