| Market Summary | Weekly Breakout Report | Top Breakout Choices | Top 2nd Chances | New Features | Tip of the Week |
The week saw another sharp turnaround known as a v-shaped bottom. Our market signals for the three major index all went to "sell" on Tuesday but the sharp recovery resulted in the trend indicator for the DJI returning to buy on Thursday. The indicators for the S&P 500 and the NASDAQ remain at "sell".
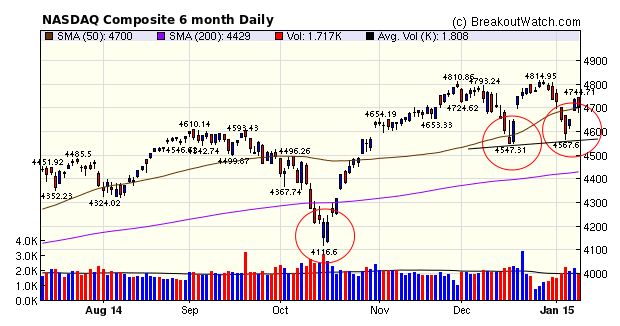
The NASDAQ chart is showing a possible head and shoulders top following Friday's reversal. This pattern will be confirmed if the index falls below the "neckline" at 4570. A head and shoulders top is a bearish pattern so a fall below 4570 could be an indication a deeper correction is in progress.
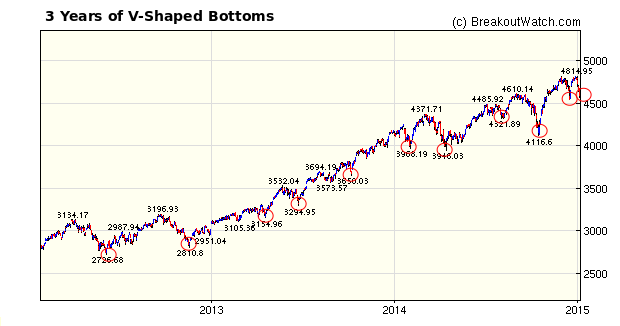
This week saw the third V-shaped bottom in 3 months but there have been many over the past few years. I discuss why and how they form in this week's top tip and how to profit from them.

The sharp reversal and above average volume on Wednesday and Thursday produced a flurry of breakouts
| Breakouts for Week Beginning 01/05/15 | ||||||||
| Brkout Date | Symbol | Base | Squeeze | BrkoutOut Price | Brkout Day Close | Last Close | Current % off BOP | Gain at Intraday High |
|---|---|---|---|---|---|---|---|---|
| 01/07/15 | ADXS | HTF | N | 9.00 | 9.12 | 11.3 | 25.56 | 25.56 |
| 01/05/15 | QURE | CwH | N | 16.50 | 17.16 | 18.34 | 11.15 | 11.15 |
| 01/05/15 | GEVA | CwH | N | 97.75 | 100.48 | 108.51 | 11.01 | 11.01 |
| 01/08/15 | ASPX | HTF | N | 54.36 | 55.81 | 59.34 | 9.16 | 9.16 |
| 01/08/15 | MCRI | SQZ | Y | 17.36 | 17.95 | 18.94 | 9.10 | 9.1 |
| 01/06/15 | ALGN | SQZ | Y | 57.39 | 57.45 | 62.58 | 9.04 | 9.04 |
| 01/07/15 | OC | HSB | N | 36.30 | 37.16 | 39 | 7.44 | 7.44 |
| 01/08/15 | HVT | HSB | N | 22.36 | 23.72 | 23.97 | 7.20 | 7.2 |
| 01/09/15 | AYI | CwH | N | 142.54 | 151.50 | 151.5 | 6.29 | 6.29 |
| 01/07/15 | CUDA | CwH | N | 38.01 | 38.92 | 38.02 | 0.03 | 5.63 |
| 01/06/15 | SPG | CwH | N | 187.46 | 191.28 | 196.57 | 4.86 | 4.86 |
| 01/07/15 | CMG | CwH | N | 693.96 | 694.26 | 714.27 | 2.93 | 3.75 |
| 01/08/15 | ENT | CwH | N | 14.43 | 14.69 | 14.65 | 1.52 | 3.53 |
| 01/08/15 | BCC | CwH | N | 38.32 | 38.63 | 38.66 | 0.89 | 3.16 |
| 01/07/15 | AMPH | CwH | N | 12.39 | 12.78 | 11.98 | -3.31 | 3.15 |
| 01/08/15 | MANH | CwH | Y | 42.38 | 43.46 | 43.52 | 2.69 | 3 |
| 01/08/15 | FSL | CwH | N | 25.85 | 26.54 | 26.57 | 2.79 | 2.79 |
| 01/08/15 | PGEM | CwH | N | 14.07 | 14.46 | 14.24 | 1.21 | 2.77 |
| 01/06/15 | VGLT | CwH | N | 78.71 | 80.84 | 80.53 | 2.31 | 2.71 |
| 01/05/15 | VGLT | CwH | N | 78.71 | 79.58 | 80.53 | 2.31 | 2.71 |
| 01/08/15 | NSP | CwH | N | 34.62 | 34.90 | 35.52 | 2.60 | 2.6 |
| 01/07/15 | BBBY | CwH | N | 77.46 | 78.21 | 74.09 | -4.35 | 2.57 |
| 01/08/15 | MPW | CwH | N | 14.37 | 14.73 | 14.66 | 2.02 | 2.51 |
| 01/08/15 | CLW | CwH | N | 71.58 | 72.67 | 72.41 | 1.16 | 1.52 |
| 01/08/15 | CENTA | CwH | N | 9.98 | 10.08 | 10.13 | 1.50 | 1.5 |
| 01/08/15 | EPHE | SQZ | Y | 38.62 | 39.19 | 38.94 | 0.83 | 1.48 |
| 01/07/15 | NTES | SQZ | Y | 102.20 | 102.62 | 103.58 | 1.35 | 1.35 |
| 01/08/15 | VVI | CwH | N | 27.31 | 27.65 | 27.25 | -0.22 | 1.24 |
| 01/07/15 | CBPO | SQZ | Y | 68.00 | 68.7 | 66.93 | -1.57 | 1.03 |
| 01/08/15 | CFP | HTF | N | 15.50 | 15.59 | 15.49 | -0.06 | 0.65 |
| 01/08/15 | PEP | DB | N | 97.36 | 97.48 | 96.82 | -0.55 | 0.56 |
| 01/08/15 | ETH | CwH | N | 31.24 | 31.33 | 31.21 | -0.10 | 0.29 |
| 01/08/15 | DY | CwH | N | 35.63 | 35.65 | 34.77 | -2.41 | 0.06 |
| 01/08/15 | CRY | CwH | N | 11.75 | 11.75 | 11.37 | -3.23 | 0 |
| Weekly Average (34 breakouts) | 3.27 | 4.45 | ||||||
No new features this week.
V-Shaped Bottoms: Why they Form and How to Profit from Them
During the bull market since April 2009, there have been many instances of of sharp falls and equally sharp reversals. These form what is known as a V-shaped bottom. They are interesting because market bottoms used to be more rounded as the downward trend stops and consolidation and recovery of confidence begins. Recognizing a V-shaped bottom can give an opportunity for quick short term gains.
This chart shows 11 clearly distinguishable v shaped bottoms in the last 3 years..

How and Why V-Shaped Bottoms Form
V-Shaped bottoms form when there is a strong trend in place with market fear that the trend will soon be broken and that a major correction is due. The longer the upward trend remains in place, the more likely are we to see V-shaped bottoms. This has been the situation in the US markets since April 20009. Shortly after a correction to the the trend starts, major market players start to believe the correction they have been expecting is finally in place and start to short the market in large numbers, causing a steep decline in prices. This decline is arrested when there is a mid-session reversal and the market closes above its lows of the day, usually on above average volume.
When this happens it triggers short covering by those who were short the market, resulting in high volume buying as they close their short positions. This causes the steep reversal we see in a V-shaped bottom.
How to Profit from a V-Shaped Bottom
Look at the 6 month NASDAQ chart above. You will see that when there was an intraday reversal, characterised by a lower shadow on the candlestick, it was followed by strong positive volume the next day. On that second and third day, you can buy breakouts with reasonable assurance that the breakout will be successful and profitable.
This week, the intraday reversal occurred on Tuesday the 6th January. In the following two days, there were 27 successful breakouts - the vast majority of the 34 recorded this week.
| Index | Value | Change Week | Change YTD | Trend | ||||||||||||||||||||||||||||||||||||
|---|---|---|---|---|---|---|---|---|---|---|---|---|---|---|---|---|---|---|---|---|---|---|---|---|---|---|---|---|---|---|---|---|---|---|---|---|---|---|---|---|
| Dow | 17737.4 | -0.54% | -0.48% | Up | ||||||||||||||||||||||||||||||||||||
| NASDAQ | 4704.07 | -0.48% | -0.68% | Down | ||||||||||||||||||||||||||||||||||||
| S&P 500 | 2044.81 | -0.65% | -0.68% | Down | ||||||||||||||||||||||||||||||||||||
1The Market Signal is derived
from our proprietary market model. The market model is
described on the site.
2The site also shows industry rankings based on fundamentals, combined technical and fundamentals, and on price alone. The site also shows daily industry movements. |
||||||||||||||||||||||||||||||||||||||||
|
Category
|
Symbol
|
Company Name
|
Expected Gain1
|
|---|---|---|---|
| Best Overall | ZAGG | ZAGG Inc | 113 |
| Top Technical | ZAGG | ZAGG Inc | 113 |
| Top Fundamental | ADS | Alliance Data Systems Corporation | 15 |
| Top Tech. & Fund. | RAX | Rackspace Hosting, Inc | 28 |
|
Category
|
Symbol
|
Company Name
|
Expected Gain1
|
|---|---|---|---|
| Best Overall | CENTA | Central Garden & Pet Company | 72 |
| Top Technical | CENTA | Central Garden & Pet Company | 72 |
| Top Fundamental | CMG | Chipotle Mexican Grill, Inc. | 29 |
| Top Tech. & Fund. | CMG | Chipotle Mexican Grill, Inc. | 29 |
If you received this newsletter from a friend and you would like to receive it regularly please go to the BreakoutWatch.com site and enter as a Guest. You will then be able to register to receive the newsletter.
Copyright © 2015 NBIcharts, LLC dba BreakoutWatch.com. All rights
reserved.
" BreakoutWatch," the BreakoutWatch.com "eye" logo, and the slogan
"tomorrow's breakouts today" are service marks of NBIcharts LLC.
All other marks are the property of their respective owners, and
are used for descriptive purposes only.
BreakoutWatch is not affiliated with Investor's Business Daily or
with Mr. William O'Neil. Our site, research and analysis is
supported entirely by subscription and is free from advertising.