| Market Summary | Weekly Breakout Report | Top Breakout Choices | Top 2nd Chances | New Features | Tip of the Week |
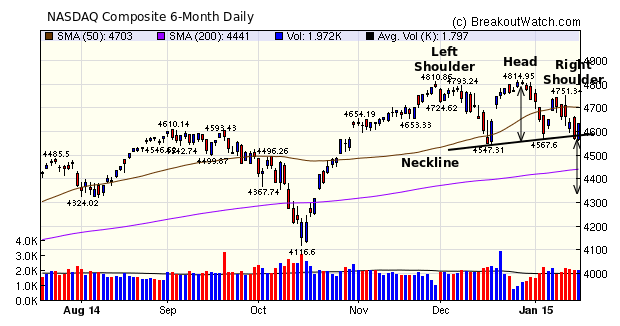
The Head and Shoulders Top pattern
(HST) for the NASDAQ that I previewed last week was confirmed on
Thursday when the index closed below the neckline. All three
major indexes show the same pattern. This would normally
be a bearish signal, but Friday's recovery on above average
volume with a close near the intraday high, puts a question mark
over the next move. I discuss how to interpret an HST pattern in
this week's top tip. The conclusion is that if the index does
not find support at the 4347 left neckline then a fall to 4350
is possible.
Thursday's fall and Friday's recovery indicate the markets are struggling to understand the impact of Switzerland decision to float the Swiss Franc. David Kotok (of Cumberland Advisors) has a simple explanation:
Thursday's fall and Friday's recovery indicate the markets are struggling to understand the impact of Switzerland decision to float the Swiss Franc. David Kotok (of Cumberland Advisors) has a simple explanation:
"For the US to have another
major, reliable, sovereign nation trading near zero on its
10-year government bond only puts more downward pressure on
global interest rates. Switzerland joins the ranks of Japan,
Germany, and others where a riskless 10-year bond is below 1%
and close to zero.
Translate all of that into the valuation of financial assets, particularly those in the US, and there is only one outcome. The general trend remains toward higher asset prices while US interest rates remain very low." (emphasis mine).
Translate all of that into the valuation of financial assets, particularly those in the US, and there is only one outcome. The general trend remains toward higher asset prices while US interest rates remain very low." (emphasis mine).

| Breakouts for Week Beginning 01/12/15 | ||||||||
| Brkout Date | Symbol | Base | Squeeze | BrkoutOut Price | Brkout Day Close | Last Close | Current % off BOP | Gain at Intraday High |
|---|---|---|---|---|---|---|---|---|
| 01/14/15 | BBRY | HSB | N | 11.06 | 12.60 | 10.24 | -7.41 | 13.92 |
| 01/15/15 | HDB | CwH | N | 53.20 | 55.66 | 57 | 7.14 | 7.14 |
| 01/12/15 | KOLD | HTF | N | 84.00 | 87.49 | 70.56 | -16.00 | 5.95 |
| 01/14/15 | SRNE | HTF | N | 10.80 | 11.38 | 9.02 | -16.48 | 5.37 |
| 01/13/15 | INAP | CwH | N | 8.35 | 8.45 | 8.79 | 5.27 | 5.27 |
| 01/13/15 | PRXL | DB | N | 59.93 | 62.46 | 62.91 | 4.97 | 4.97 |
| 01/16/15 | CLDX | CwH | N | 19.45 | 20.30 | 20.3 | 4.37 | 4.37 |
| 01/12/15 | PACB | CwH | N | 8.00 | 8.30 | 7.86 | -1.75 | 4.25 |
| 01/15/15 | EPI | CwH | N | 22.61 | 23.16 | 23.53 | 4.07 | 4.07 |
| 01/16/15 | NVAX | CwH | N | 6.59 | 6.81 | 6.81 | 3.34 | 3.34 |
| 01/13/15 | PCYC | CwH | N | 141.55 | 144.00 | 145.51 | 2.80 | 2.8 |
| 01/13/15 | SPWR | HSB | N | 26.28 | 26.57 | 24.51 | -6.74 | 2.28 |
| 01/14/15 | TEDU | SQZ | Y | 11.72 | 11.96 | 11.71 | -0.09 | 2.05 |
| 01/16/15 | AMBC | CwH | N | 26.12 | 26.63 | 26.63 | 1.95 | 1.95 |
| 01/14/15 | DCT | HTF | N | 36.88 | 37.50 | 37.55 | 1.82 | 1.82 |
| 01/16/15 | CISG | CwH | N | 8.33 | 8.48 | 8.48 | 1.80 | 1.8 |
| 01/13/15 | ATRC | CwH | N | 20.09 | 20.37 | 20.12 | 0.15 | 1.39 |
| 01/14/15 | RUTH | CwH | N | 15.18 | 15.32 | 15.25 | 0.46 | 0.92 |
| 01/14/15 | CRUS | SQZ | Y | 24.04 | 24.26 | 23.97 | -0.29 | 0.92 |
| 01/13/15 | QLGC | CwH | N | 13.44 | 13.55 | 13.2 | -1.79 | 0.82 |
| 01/16/15 | AEIS | CwH | N | 24.22 | 24.41 | 24.41 | 0.78 | 0.78 |
| 01/16/15 | MNR | CwH | N | 11.89 | 11.98 | 11.98 | 0.76 | 0.76 |
| 01/14/15 | GRT | CwH | N | 13.96 | 13.96 | 15.25 | N/A | 0.72 |
| 01/15/15 | GRT | CwH | N | 13.96 | 14.06 | 57 | N/A | 0.72 |
| 01/13/15 | CHL | DB | N | 63.17 | 63.26 | 63 | -0.27 | 0.14 |
| Weekly Average (25 breakouts) | -0.45 | 3.14 | ||||||
No new features this week
Interpreting
a Head and Shoulders Top
The head and shoulders top (HST) that the three major indexes completed this week is one of the most reliable bearish pattern. Our analysis shows that it is successful 73% of the time and reaches its target price 59% of the time. It forms after an uptrend and is characterized by three peaks with the center peak higher than the two adjoining peaks. The neckline is a line drawn between the two intraday lows between the peaks.
Our own research and backtest results are in the Newsletter Archive.
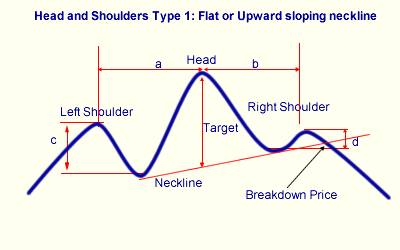
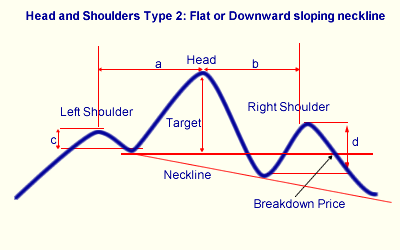
We recognize two types of head and shoulder top, depending on the slope of the neckline. We do this so we can recognize a breakdown price and issue alerts when this price is met.

When the neckline is flat or slopes upwards, the breakdown price is calculated as the point where the neckline intersects the price line following formation of the right shoulder. It is at this point that the pattern is completed and a long position should be closed, or a short position opened. At this time we can calculate a 'target' decline which is the distance between the center peak's high and the neckline.

If the neckline slopes down, then it is possible that it will never intersect the price line following the right shoulder, so we use an alternative method of determining a breakdown price. In this case we use the support level between the left shoulder and the head and calculate the target price as the difference between that support level and the center peak's high.
Pattern Recognition
Our algorithm will recognize a head and shoulders top pattern when the following conditions are met.
The head and shoulders top (HST) that the three major indexes completed this week is one of the most reliable bearish pattern. Our analysis shows that it is successful 73% of the time and reaches its target price 59% of the time. It forms after an uptrend and is characterized by three peaks with the center peak higher than the two adjoining peaks. The neckline is a line drawn between the two intraday lows between the peaks.
Our own research and backtest results are in the Newsletter Archive.
We recognize two types of head and shoulder top, depending on the slope of the neckline. We do this so we can recognize a breakdown price and issue alerts when this price is met.

When the neckline is flat or slopes upwards, the breakdown price is calculated as the point where the neckline intersects the price line following formation of the right shoulder. It is at this point that the pattern is completed and a long position should be closed, or a short position opened. At this time we can calculate a 'target' decline which is the distance between the center peak's high and the neckline.

If the neckline slopes down, then it is possible that it will never intersect the price line following the right shoulder, so we use an alternative method of determining a breakdown price. In this case we use the support level between the left shoulder and the head and calculate the target price as the difference between that support level and the center peak's high.
Pattern Recognition
Our algorithm will recognize a head and shoulders top pattern when the following conditions are met.
- The stock must be in a confirmed up trend before the pattern begins. An uptrend exists if the the left shoulder is at least 30% higher than the low in the previous 6 months (120 trading days).
- The pattern width, shoulder-to-shoulder, must be 6 months (120 trading days) or less.
- The head must have occurred within the last 6 months (120 trading days).
- There must be approximate symmetry to the pattern. We determine this by requiring that number days between the shoulders and the head (a and b in the diagram) must be within 50% of each other.
- There must be a noticeable trough between the left shoulder and the head (c). We chose an arbitrary minimum of 2%. This is measured from the left shoulder intraday high to the intraday high at the left neckline.
- There must be a noticeable trough between the head and the right shoulder (d). We chose an arbitrary minimum of 2%. This is measured from the right shoulder intraday high to the intraday high at the right neckline.
- For upward sloping necklines, the breakdown price is the the neckline value on the date of the last close.
- For flat or downward sloping neckline, the breakdown price is the value of the intraday low at the left neckline.
- The last close must be above the breakdown price.
- The minimum 50 day average volume must be at least 500,000. Stocks with greater liquidity are less likely to make sudden moves creating a short squeeze.
| Index | Value | Change Week | Change YTD | Trend | ||||||||||||||||||||||||||||||||||||
|---|---|---|---|---|---|---|---|---|---|---|---|---|---|---|---|---|---|---|---|---|---|---|---|---|---|---|---|---|---|---|---|---|---|---|---|---|---|---|---|---|
| Dow | 17511.6 | -1.27% | -1.75% | Down | ||||||||||||||||||||||||||||||||||||
| NASDAQ | 4634.38 | -1.48% | -2.15% | Down | ||||||||||||||||||||||||||||||||||||
| S&P 500 | 2019.42 | -1.24% | -1.92% | Down | ||||||||||||||||||||||||||||||||||||
1The Market Signal is derived
from our proprietary market model. The market model is
described on the site.
2The site also shows industry rankings based on fundamentals, combined technical and fundamentals, and on price alone. The site also shows daily industry movements. |
||||||||||||||||||||||||||||||||||||||||
|
Category
|
Symbol
|
Company Name
|
Expected Gain1
|
|---|---|---|---|
| Best Overall | ZAGG | ZAGG Inc | 107 |
| Top Technical | ZAGG | ZAGG Inc | 107 |
| Top Fundamental | ILMN | Illumina, Inc. | 42 |
| Top Tech. & Fund. | MWIV | MWI Veterinary Supply, Inc. | 28 |
|
Category
|
Symbol
|
Company Name
|
Expected Gain1
|
|---|---|---|---|
| Best Overall | NVAX | Novavax, Inc. | 101 |
| Top Technical | NVAX | Novavax, Inc. | 101 |
| Top Fundamental | CISG | CNinsure Inc. | 84 |
| Top Tech. & Fund. | CISG | CNinsure Inc. | 84 |
If you received this newsletter from a friend and you would like to receive it regularly please go to the BreakoutWatch.com site and enter as a Guest. You will then be able to register to receive the newsletter.
Copyright © 2015 NBIcharts, LLC dba BreakoutWatch.com. All rights
reserved.
" BreakoutWatch," the BreakoutWatch.com "eye" logo, and the slogan
"tomorrow's breakouts today" are service marks of NBIcharts LLC.
All other marks are the property of their respective owners, and
are used for descriptive purposes only.
BreakoutWatch is not affiliated with Investor's Business Daily or
with Mr. William O'Neil. Our site, research and analysis is
supported entirely by subscription and is free from advertising.