| Market Summary | Weekly Breakout Report | Top Breakout Choices | Top 2nd Chances | New Features | Tip of the Week |
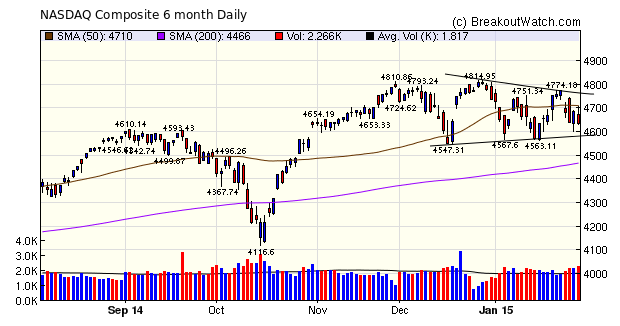
The NASDAQ Composite continues to consolidate, trading within a range shown on the chart below. Volatility is high reflecting the uncertainty in earnings reports, the Eurozone and the impact of falling oil prices.
The extent to which daily volatility has increased is reflected in the height of the candlesticks. Notice how the height in the last two months has increased compared to the period from mid-October to the end of 2014. This high volatility can be good for day traders but swing traders can be easily burnt.
The number of breakouts fell to 18 this week compared to 30 a week ago. The top two performers had RS values of 95 and 91 respectively which is consistent with our long held view that an RS Rank above 90 improves the probability of success.
Of the 18 breakouts, 7 were under water at Friday's close illustrating my point above that the volatility we are seeing can be good for the day trader but if hold for more than a day or two you can be burned.
| Breakouts for Week Beginning 01/26/15 | ||||||||
| Brkout Date | Symbol | Base | Squeeze | BrkoutOut Price | Brkout Day Close | Last Close | Current % off BOP | Gain at Intraday High |
|---|---|---|---|---|---|---|---|---|
| 01/26/15 | MDGN | CwH | N | 7.12 | 7.85 | 8.3 | 16.57 | 16.57 |
| 01/28/15 | MRCY | CwH | N | 14.74 | 15.33 | 15.78 | 7.06 | 10.65 |
| 01/26/15 | DEG | CwH | N | 19.56 | 20.74 | 20.69 | 5.78 | 8.33 |
| 01/26/15 | CSTE | DB | N | 61.15 | 63.25 | 62.1 | 1.55 | 3.94 |
| 01/30/15 | HP | HSB | N | 57.70 | 59.56 | 59.56 | 3.22 | 3.22 |
| 01/26/15 | SKYW | CwH | N | 13.37 | 13.78 | 12.55 | -6.13 | 3.07 |
| 01/27/15 | DRNA | HTF | N | 21.09 | 21.71 | 21.32 | 1.09 | 2.94 |
| 01/27/15 | ZIOP | HTF | N | 8.87 | 8.93 | 8.95 | 0.90 | 2.37 |
| 01/26/15 | LZB | SQZ | Y | 27.46 | 27.98 | 26.69 | -2.80 | 1.89 |
| 01/29/15 | CBT | HSB | N | 42.36 | 43.12 | 42.41 | 0.12 | 1.79 |
| 01/26/15 | ZFGN | HTF | N | 40.15 | 40.36 | 38.01 | -5.33 | 1.72 |
| 01/29/15 | CEMP | HTF | N | 27.75 | 27.97 | 27.74 | -0.04 | 0.79 |
| 01/28/15 | ENDP | CwH | N | 81.04 | 81.20 | 79.61 | -1.76 | 0.74 |
| 01/28/15 | GCA | HSB | N | 6.83 | 6.87 | 6.61 | -3.22 | 0.59 |
| 01/26/15 | AMT | DB | N | 101.47 | 101.76 | 96.95 | -4.45 | 0.4 |
| 01/30/15 | LEA | CwH | N | 99.99 | 100.35 | 100.35 | 0.36 | 0.36 |
| 01/30/15 | FAZ | HSB | N | 14.64 | 14.68 | 14.68 | 0.27 | 0.27 |
| 01/26/15 | MSTR | SQZ | Y | 168.11 | 168.3 | 161.6 | -3.87 | 0.11 |
| Weekly Average (18 breakouts) | 0.52 | 3.32 | ||||||
No new features this week.
Why stocks with an RS Rank > 90 have a Higher Probability of Success
To illustrate the RS Rank > 90 recommendation, I return to an analysis published in July, 2013
From the earliest days of our website, I found that RS rank was highly correlated with performance after breakout. In 2010 I studied the evidence for why this is so in more detail and present it again for our new readers.
RS Rank can take values from 1 to 99 but we only select stocks with an RS Rank of at least 70 for our cup-with-handle pattern and publish only those with an RS >= 80 . Looking at our data since 2004 we can see how stocks in each percentile performed. The chart below shows the mean performance after breakout for each RS percentile measured from breakout price to highest gain after breakout.
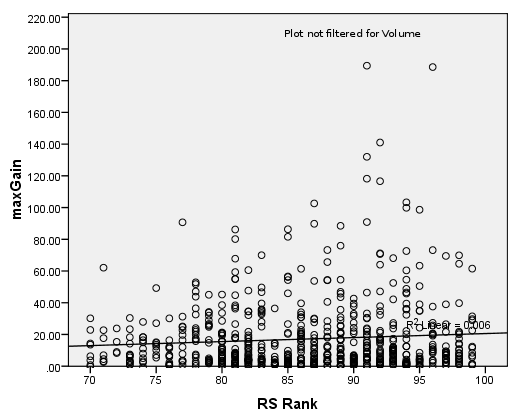
The
graph clearly shows that there is a positive relationship
between RS rank and subsequent performance after breakout.
This is confirmed by the positive slope of the regression
line through the data. The data for this plot was not
filtered by volume on breakout day and therefore includes
all volume levels.
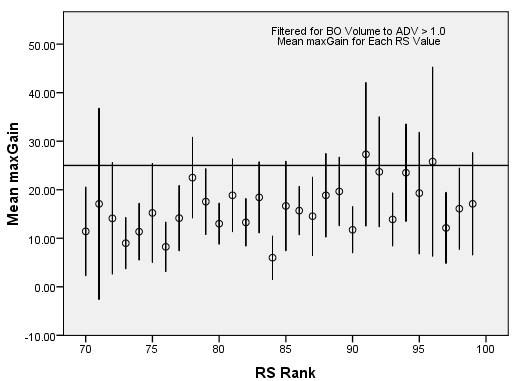
The
next chart shows the spread around the mean of the
highest gains for each percentile. The
circles represent the mean maximum gain after
breakout for each value of RS rank. The vertical
bars represent the standard error in estimating
the mean from our sample. If
we are aiming for a gain of 25% after breakout, we
can see that its only RS values in the range 90 to
96 that consistently produce the target
return. Interestingly, it seems that RS values above
96 perform only at an average level, indicating that
these stocks are perhaps overvalued with less
potential for further gains.
While breakouts from a cup-with-handle base can perform well on average, the best potential for highest gain comes from stocks in the 90-96 range.
| Index | Value | Change Week | Change YTD | Trend | ||||||||||||||||||||||||||||||||||||
|---|---|---|---|---|---|---|---|---|---|---|---|---|---|---|---|---|---|---|---|---|---|---|---|---|---|---|---|---|---|---|---|---|---|---|---|---|---|---|---|---|
| Dow | 17672.6 |
-2.87% | -3.69% | Down | ||||||||||||||||||||||||||||||||||||
| NASDAQ | 4757.88 | -2.58% | -2.13% | Down | ||||||||||||||||||||||||||||||||||||
| S&P 500 | 2051.82 | -2.77% | -3.10% | Down | ||||||||||||||||||||||||||||||||||||
1The Market Signal is derived
from our proprietary market model. The market model is
described on the site.
2The site also shows industry rankings based on fundamentals, combined technical and fundamentals, and on price alone. The site also shows daily industry movements. |
||||||||||||||||||||||||||||||||||||||||
|
Category
|
Symbol
|
Company Name
|
Expected Gain1
|
|---|---|---|---|
| Best Overall | ORPN | Bio Blast Pharma Ltd. | 100 |
| Top Technical | ORPN | Bio Blast Pharma Ltd. | 100 |
| Top Fundamental | CBPO | China Biologic Products, Inc. | 38 |
| Top Tech. & Fund. | CBPO | China Biologic Products, Inc. | 38 |
|
Category
|
Symbol
|
Company Name
|
Expected Gain1
|
|---|---|---|---|
| Best Overall | SKYW | SkyWest, Inc. | 51 |
| Top Technical | LEA | Lear Corporation | 27 |
| Top Fundamental | LEA | Lear Corporation | 27 |
| Top Tech. & Fund. | LEA | Lear Corporation | 27 |
If you received this newsletter from a friend and you would like to receive it regularly please go to the BreakoutWatch.com site and enter as a Guest. You will then be able to register to receive the newsletter.
Copyright © 2015 NBIcharts, LLC dba BreakoutWatch.com. All rights
reserved.
" BreakoutWatch," the BreakoutWatch.com "eye" logo, and the slogan
"tomorrow's breakouts today" are service marks of NBIcharts LLC.
All other marks are the property of their respective owners, and
are used for descriptive purposes only.
BreakoutWatch is not affiliated with Investor's Business Daily or
with Mr. William O'Neil. Our site, research and analysis is
supported entirely by subscription and is free from advertising.