| Market Summary | Weekly Breakout Report | Top Breakout Choices | Top 2nd Chances | New Features | Tip of the Week |
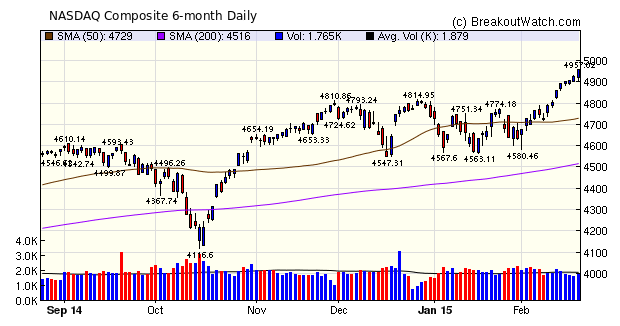
The NASDAQ posted its eighth straight day of gains on Friday. It closed at 4956 leaving it just 2% short of its March 2000 high of 5049. With a gain of 1.3% for the week it doubled the gains of the other two major indexes but volumes remained well below the 50 day average. The low volume was mostly attributable to uncertainty over the Greek bailout. That should be resolved now there is a 4 month draft deal in the works, so volumes should improve next week and the rally should continue although the some resistance may be met at 5049.
There were just 11 breakouts this week with the number kept low by the shortened week but mainly by the low volume levels, because we need a 1.5 times average 50 day volume to declare a breakout on all patterns except the High Tight Flag. We explain that pattern further below.
| Breakouts for Week Beginning 02/16/15 | |||||||||
| Brkout Date | Symbol | Base | Squeeze | BrkoutOut Price | Brkout Day Close | RS Rank* | Last Close | Current % off BOP | Gain at Intraday High |
|---|---|---|---|---|---|---|---|---|---|
| 02/20/15 | HZNP | CwH | N | 17.55 | 18.53 | 96.00 | 18.53 | 5.58 | 7.98 |
| 02/17/15 | CEMP | HTF | Y | 27.97 | 28.28 | 99.00 | 29.61 | 5.86 | 5.86 |
| 02/18/15 | BV | CwH | N | 8.73 | 9.04 | 91.00 | 9.24 | 5.84 | 5.84 |
| 02/19/15 | FRGI | CwH | N | 64.33 | 66.99 | 93.00 | 64.96 | 0.98 | 4.13 |
| 02/18/15 | WCG | CwH | N | 82.35 | 83.12 | 88.00 | 84.62 | 2.76 | 2.76 |
| 02/19/15 | CRAI | DB | Y | 30.99 | 31.21 | 84.00 | 31.82 | 2.68 | 2.68 |
| 02/18/15 | ARMH | CwH | N | 50.41 | 51.40 | 83.00 | 51.68 | 2.52 | 2.52 |
| 02/19/15 | FB | DB | N | 78.00 | 79.42 | 75.00 | 79.9 | 2.44 | 2.44 |
| 02/19/15 | AMAT | CwH | N | 24.67 | 24.93 | 80.00 | 25.13 | 1.86 | 1.86 |
| 02/20/15 | EGL | CwH | N | 48.06 | 48.38 | 86.00 | 48.38 | 0.67 | 0.67 |
| 02/18/15 | VEEV | CwH | N | 30.97 | 31.00 | 91.00 | 30.58 | -1.26 | 0.1 |
| Weekly Average (11 breakouts) | 2.72 | 3.35 | |||||||
| *RS Rank on day before breakout. | |||||||||
No new Features this week
High Tight Flag: Rare but is it Profitable Compared to Cup and Handle?
CEMP broke out from a High Tight Flag (HTF) pattern this week and gained 5.9% until Friday's close. The stock also happened to be in a volatility squeeze before breakout, which may have helped it pop.
In How to Make Money in Stocks, William J. O'Neil identified the High, Tight Flag pattern as rare but potentially highly profitable. In his Encyclopedia of Chart Patterns, (John Wiley and Sons, 2000) Thomas Bulkowski found they were not so rare but also very profitable, provided you waited for the breakout to enter the trade. When we introduced the pattern in 2007, our analysis at the time confirmed Bulkowki (see Newsletter for 12/29/07 ).
Looking back at that analysis now, I see that it was flawed because I only considered the maximum gain after breakout, without considering any drawdown.
I've taken another look at the performance of HTF breakouts during 2014. It was a strong year for breakouts so if the HTF pattern is profitable, we should see it then. I considered performance over 7-14 days which is the typical period for a swing trader. I didn't consider the day trade situation, or the buy and hold performance. During 2014, there were 56 HTF breakouts.
After 7 days, with no stop loss,
the average gain from breakout price was -0.6% with a maximum
drawdown of 35%
After 14 days, with no stop loss, the average gain from breakout price was -3.4% with maximum drawdown of 35%
After 7 days, with a 7% stop loss, the average gain from breakout price was 1.7%
After 14 days, with a 7% stop loss, the average gain from breakout price was -0.2%
After 14 days, with no stop loss, the average gain from breakout price was -3.4% with maximum drawdown of 35%
After 7 days, with a 7% stop loss, the average gain from breakout price was 1.7%
After 14 days, with a 7% stop loss, the average gain from breakout price was -0.2%
So while eventual gains might be quite strong, it is unlikely that a trader would have held the position long enough to make an acceptable profit.
When we compare that to the cup and handle pattern we get a much better result. During 2014, there were 686 CWH breakouts.
After 7 days, with no stop loss,
the average gain from breakout price was 3.1% with a maximum
drawdown of 48%
After 14 days, with no stop loss, the average gain from breakout price was 3.2% with maximum drawdown of 48%
After 7 days, with a 7% stop loss, the average gain from breakout price was 3.4%
After 14 days, with a 7% stop loss, the average gain from breakout price was 4.0%
After 14 days, with no stop loss, the average gain from breakout price was 3.2% with maximum drawdown of 48%
After 7 days, with a 7% stop loss, the average gain from breakout price was 3.4%
After 14 days, with a 7% stop loss, the average gain from breakout price was 4.0%
Now, it may be that HTF positions still held after 14 days may go on to be more profitable than CWH positions but that will require a more detailed analysis.
Conclusion
- For the swing trader, the cup and handle pattern is substantially more profitable on average than the high tight flag pattern.
- For the swing trader, it is important to apply stop loss factors. Over 14 days, the average profit for the CWH patter was 4.0% when a 7% stop loss was used compared to 3.2% without a stop loss. That's a 25% improvement.
| Index | Value | Change Week | Change YTD | Trend | ||||||||||||||||||||||||||||||||||||
|---|---|---|---|---|---|---|---|---|---|---|---|---|---|---|---|---|---|---|---|---|---|---|---|---|---|---|---|---|---|---|---|---|---|---|---|---|---|---|---|---|
| Dow | 18140.4 | 0.67% | 1.78% | Up | ||||||||||||||||||||||||||||||||||||
| NASDAQ | 4955.97 | 1.27% | 4.64% | Up | ||||||||||||||||||||||||||||||||||||
| S&P 500 | 2110.3 | 0.63% | 2.5% | Up | ||||||||||||||||||||||||||||||||||||
1The Market Signal is derived
from our proprietary market model. The market model is
described on the site.
2The site also shows industry rankings based on fundamentals, combined technical and fundamentals, and on price alone. The site also shows daily industry movements. |
||||||||||||||||||||||||||||||||||||||||
|
Category
|
Symbol
|
Company Name
|
Expected Gain1
|
|---|---|---|---|
| Best Overall | PGNX | Progenics Pharmaceuticals Inc. | 112 |
| Top Technical | PGNX | Progenics Pharmaceuticals Inc. | 112 |
| Top Fundamental | VDSI | VASCO Data Security International, Inc. | 52 |
| Top Tech. & Fund. | VDSI | VASCO Data Security International, Inc. | 52 |
|
Category
|
Symbol
|
Company Name
|
Expected Gain1
|
|---|---|---|---|
| Best Overall | VEEV | Veeva Systems Inc. | 52 |
| Top Technical | EGL | Engility Holdings, Inc. | 32 |
| Top Fundamental | VEEV | Veeva Systems Inc. | 52 |
| Top Tech. & Fund. | FRGI | Fiesta Restaurant Group, Inc. | 44 |
If you received this newsletter from a friend and you would like to receive it regularly please go to the BreakoutWatch.com site and enter as a Guest. You will then be able to register to receive the newsletter.
Copyright © 2015 NBIcharts, LLC dba BreakoutWatch.com. All rights
reserved.
" BreakoutWatch," the BreakoutWatch.com "eye" logo, and the slogan
"tomorrow's breakouts today" are service marks of NBIcharts LLC.
All other marks are the property of their respective owners, and
are used for descriptive purposes only.
BreakoutWatch is not affiliated with Investor's Business Daily or
with Mr. William O'Neil. Our site, research and analysis is
supported entirely by subscription and is free from advertising.