| Market Summary | Weekly Breakout Report | Top Breakout Choices | Top 2nd Chances | New Features | Tip of the Week |
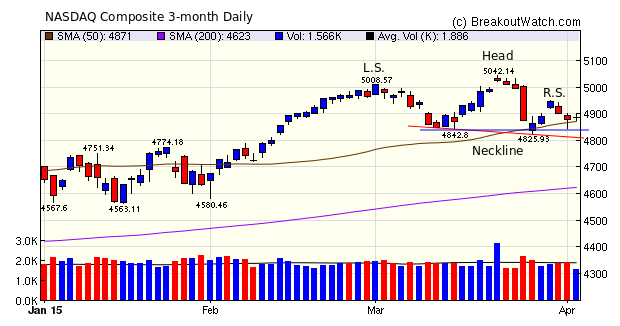
The NASDAQ was slightly down for the week with a fall of just 0.1%. Monday's gap up was promising, but it was downhill from there leaving the index in a possible bearish head and shoulders top formation. The neck of the left shoulder (blue line on the chart below) provided support on Wednesday and our trend indicator remains positive. The possible head and and shoulders top pattern (HST) will be confirmed as bearish if the price line falls through the blue line at 4842. The probability of this is 58% based on our analysis of 8,700 HST patterns in our database. To learn more about how we recognize a head and shoulders top, see our top tip below.
The markets were closed on Friday and could not react to the disappointing job data. The downturn almost certainly further delays any increase in interest rates by the Federal Reserve, to which the markets may react positively on Monday.
The number of breakouts rose to 20 from 7 last week but gains were meager as the initial surge of the week gave way to falling prices and lower volumes.
| Breakouts for Week Beginning 03/30/15 | |||||||||
| Brkout Date | Symbol | Base | Squeeze | BrkoutOut Price | Brkout Day Close | RS Rank* | Last Close | Current % off BOP | Gain at Intraday High |
|---|---|---|---|---|---|---|---|---|---|
| 03/31/15 | CBPX | CwH | N | 21.07 | 22.59 | 90 | 22.54 | 6.98 | 7.21 |
| 04/01/15 | EGRX | HTF | N | 46.09 | 46.47 | 99 | 48.47 | 5.16 | 5.16 |
| 04/01/15 | GNCMA | CwH | N | 16.22 | 16.92 | 93 | 16.96 | 4.56 | 4.56 |
| 03/30/15 | MASI | CwH | Y | 32.16 | 32.76 | 92 | 33.45 | 4.01 | 4.01 |
| 04/01/15 | IRDM | SQZ | Y | 9.81 | 10.15 | 77 | 10.2 | 3.98 | 3.98 |
| 03/31/15 | FNHC | CwH | N | 30.59 | 30.60 | 89 | 30.16 | -1.41 | 2.84 |
| 04/02/15 | BGCP | CwH | N | 9.55 | 9.81 | 86 | 9.81 | 2.72 | 2.72 |
| 03/30/15 | THRM | CwH | N | 49.27 | 49.94 | 87 | 49.21 | -0.12 | 2.52 |
| 04/01/15 | CW | SQZ | Y | 74.04 | 75.12 | 75 | 75.79 | 2.36 | 2.36 |
| 03/31/15 | RDY | CwH | N | 56.37 | 57.10 | 83 | 56.52 | 0.27 | 1.3 |
| 04/02/15 | BONA | CwH | N | 7.86 | 7.95 | 83 | 7.95 | 1.15 | 1.15 |
| 04/01/15 | ATSG | CwH | N | 9.33 | 9.41 | 81 | 9.21 | -1.29 | 0.86 |
| 03/31/15 | ELOS | CwH | N | 12.31 | 12.38 | 82 | 12.11 | -1.62 | 0.57 |
| 04/01/15 | RDI | CwH | N | 13.65 | 13.71 | 95 | 13.51 | -1.03 | 0.44 |
| 04/02/15 | TILE | CwH | N | 20.99 | 21.08 | 84 | 21.08 | 0.43 | 0.43 |
| 04/02/15 | RAD | CwH | N | 8.76 | 8.79 | 93 | 8.79 | 0.34 | 0.34 |
| 04/01/15 | MTX | SQZ | Y | 73.20 | 73.38 | 77 | 73.27 | 0.10 | 0.25 |
| 03/31/15 | SIVB | SQZ | Y | 126.98 | 127.04 | 70 | 125.89 | -0.86 | 0.05 |
| 04/02/15 | PFNX | HTF | N | 17.35 | 17.35 | 99 | 17.35 | 0.00 | 0 |
| 04/01/15 | ATTO | CwH | N | 12.20 | 12.20 | 80 | 12.19 | -0.08 | 0 |
| Weekly Average (20 breakouts) | 1.28 | 2.04 | |||||||
| *RS Rank on day before breakout. | |||||||||
Watchlists now show that they are for trading at the next session. Previously we showed the date on which the watchlists were prepared, which created some confusion.
How to Recognize a Head and Shoulders Top Bearish Pattern
The head and shoulders top pattern (HST) is recognized as one of the most reliable bearish trend reversal patterns. Our data for 8700 HST patterns since 2006 shows that it is successful 58% of the time but reaches its target price just 30% of the time in the first 28 days after breakdown. This is less successful than we previously reported in our Newsletter Archive. On reaching the breakdown price, the stock continues to fall in 68% of the cases.
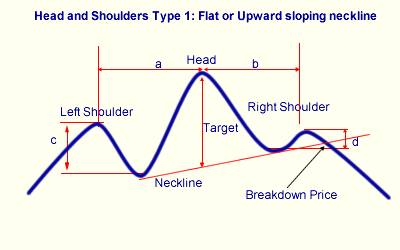
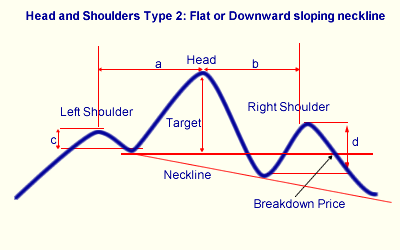
An HST pattern forms after an uptrend and is characterized by three peaks with the center peak higher than the two adjoining peaks. The neckline is a line drawn between the two intraday lows between the peaks.
We recognize two types of head and shoulder top, depending on the slope of the neckline. We do this so we can recognize a breakdown price and issue alerts when this price is met.
Pattern Recognition
Our algorithm will recognize a head and shoulders top pattern when the following conditions are met.- The stock must be in a confirmed up trend before the pattern begins. An uptrend exists if the the left shoulder is at least 30% higher than the low in the previous 6 months (120 trading days).
- The pattern width, shoulder-to-shoulder, must be 6 months (120 trading days) or less.
- The head must have occurred within the last 6 months (120 trading days).
- There must be approximate symmetry to the pattern. We determine this by requiring that number days between the shoulders and the head (a and b in the diagram) must be within 50% of each other.
- There must be a noticeable trough between the left shoulder and the head (c). We chose an arbitrary minimum of 2%. This is measured from the left shoulder intraday high to the intraday high at the left neckline.
- There must be a noticeable trough between the head and the right shoulder (d). We chose an arbitrary minimum of 2%. This is measured from the right shoulder intraday high to the intraday high at the right neckline.
- For upward sloping necklines, the breakdown price is the the neckline value on the date of the last close.
- For flat or downward sloping neckline, the breakdown price is the value of the intraday low at the left neckline.
- The last close must be above the breakdown price.
- The minimum 50 day average volume must be at least 500,000. Stocks with greater liquidity are less likely to make sudden moves creating a short squeeze.
| Index | Value | Change Week | Change YTD | Trend | ||||||||||||||||||||||||||||||||||||
|---|---|---|---|---|---|---|---|---|---|---|---|---|---|---|---|---|---|---|---|---|---|---|---|---|---|---|---|---|---|---|---|---|---|---|---|---|---|---|---|---|
| Dow | 17763.2 | 0.29% | -0.34% | Down | ||||||||||||||||||||||||||||||||||||
| NASDAQ | 4886.94 | -0.09% | 3.19% | Up | ||||||||||||||||||||||||||||||||||||
| S&P 500 | 2066.96 | 0.29% | 0.39% | Down | ||||||||||||||||||||||||||||||||||||
1The Market Signal is derived
from our proprietary market model. The market model is
described on the site.
2The site also shows industry rankings based on fundamentals, combined technical and fundamentals, and on price alone. The site also shows daily industry movements. |
||||||||||||||||||||||||||||||||||||||||
|
Category
|
Symbol
|
Company Name
|
Expected Gain1
|
|---|---|---|---|
| Best Overall | MWW | Monster Worldwide, Inc. | 99 |
| Top Technical | MWW | Monster Worldwide, Inc. | 99 |
| Top Fundamental | GTN | Gray Television, Inc. | 64 |
| Top Tech. & Fund. | GTN | Gray Television, Inc. | 64 |
|
Category
|
Symbol
|
Company Name
|
Expected Gain1
|
|---|---|---|---|
| Best Overall | RAD | Rite Aid Corporation | 95 |
| Top Technical | RAD | Rite Aid Corporation | 95 |
| Top Fundamental | FNHC | Federated National Holding Company | 51 |
| Top Tech. & Fund. | FNHC | Federated National Holding Company | 51 |
If you received this newsletter from a friend and you would like to receive it regularly please go to the BreakoutWatch.com site and enter as a Guest. You will then be able to register to receive the newsletter.
Copyright © 2015 NBIcharts, LLC dba BreakoutWatch.com. All rights
reserved.
" BreakoutWatch," the BreakoutWatch.com "eye" logo, and the slogan
"tomorrow's breakouts today" are service marks of NBIcharts LLC.
All other marks are the property of their respective owners, and
are used for descriptive purposes only.
BreakoutWatch is not affiliated with Investor's Business Daily or
with Mr. William O'Neil. Our site, research and analysis is
supported entirely by subscription and is free from advertising.