| Market Summary | Weekly Breakout Report | Top Breakout Choices | Top 2nd Chances | New Features | Tip of the Week |
The US market had a good week and all our trend indicators are now showing an upward trend for the three main indicators. The NASDAQ posted three accumulation days and outperformed the DJI and S&P 500. For the year the NASDAQ has gained 5.5% whereas the S&P 500 has gained only 2.1%.
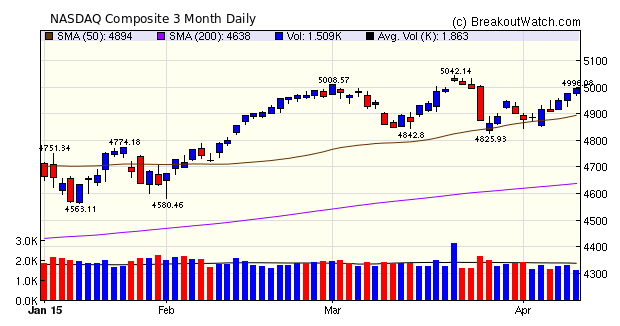
Despite the strong gains by the major indexes, volumes were mostly at or below the 50 day average. This limits the number of breakouts as we require a 50% volume increase on breakout day to confirm a breakout, except for High Tight Flag breakouts. Most breakouts came from a volatility squeeze situation (SQZ). CUDA broke out from a comparatively rare cup and handle pattern with squeeze to gain 11.6%. More on CWH squeeze breakouts in our Top Tip below.
| Breakouts for Week Beginning 04/06/15 | |||||||||
| Brkout Date | Symbol | Base | Squeeze | BrkoutOut Price | Brkout Day Close | RS Rank* | Last Close | Current % off BOP | Gain at Intraday High |
|---|---|---|---|---|---|---|---|---|---|
| 04/09/15 | REPH | HTF | N | 9.40 | 9.73 | 98 | 11.17 | 18.83 | 18.83 |
| 04/07/15 | CUDA | CwH | Y | 40.39 | 40.63 | 85 | 45.08 | 11.61 | 11.61 |
| 04/08/15 | AFOP | CwH | N | 17.82 | 18.06 | 83 | 19.35 | 8.59 | 8.59 |
| 04/10/15 | NRP | HSB | N | 6.82 | 7.37 | 3 | 7.37 | 8.06 | 8.06 |
| 04/07/15 | LULU | DB | N | 65.74 | 66.41 | 92 | 68.86 | 4.75 | 6.13 |
| 04/06/15 | WBMD | SQZ | Y | 45.24 | 46 | 71 | 47.11 | 4.13 | 6.08 |
| 04/09/15 | AFOP | SQZ | Y | 18.26 | 19.06 | 87 | 19.35 | 5.97 | 5.97 |
| 04/09/15 | SWIR | SQZ | Y | 36.12 | 36.81 | 90 | 37.58 | 4.04 | 4.04 |
| 04/08/15 | RMBS | SQZ | Y | 13.20 | 13.54 | 70 | 13.73 | 4.02 | 4.02 |
| 04/06/15 | IMAX | SQZ | Y | 35.45 | 35.9 | 87 | 36.18 | 2.06 | 2.48 |
| 04/10/15 | SQBG | CwH | N | 13.64 | 13.96 | 86 | 13.96 | 2.35 | 2.35 |
| 04/06/15 | HRC | SQZ | Y | 49.63 | 49.63 | 81 | 50.71 | 2.18 | 2.18 |
| 04/07/15 | CHEF | SQZ | Y | 22.37 | 22.43 | 75 | 21.57 | -3.58 | 2.1 |
| 04/10/15 | SIRO | SQZ | Y | 91.37 | 92.05 | 71 | 92.05 | 0.74 | 0.74 |
| 04/06/15 | LNDC | SQZ | Y | 14.69 | 14.78 | 81 | 14.47 | -1.50 | 0.61 |
| 04/10/15 | PZE | CwH | N | 7.40 | 7.44 | 93 | 7.44 | 0.54 | 0.54 |
| Weekly Average (16 breakouts) | 4.55 | 5.27 | |||||||
| *RS Rank on day before breakout. | |||||||||
I've added Social Media 'like' buttons to most of our pages. Please use these to recommend our pages to your friends. This helps to promote the site and support our service.
Breakouts from a Cup and Handle Pattern with Volatility Squeeze Provide Best Breakout Day Pop.
The CUDA breakout this week is an excellent example of a breakout from a cup and handle pattern with a volatility squeeze in the handle. A "Volatility Squeeze" occurs when the volatility of a stock falls below its recent levels. A fall in volatility usually means that the stock is in a period of consolidation and trending in a narrow range. When that period of consolidation ends, normal volatility will return resulting in a breakout to the upside or downside. We detect a "squeeze" when the 2 standard deviation Bollinger Band (BB) narrows to within the Keltner Channel (KC).
The chart for CUDA shows that the stock was in a volatility squeeze as it formed its pivot and continued into the handle. The stock broke out from both its handle and squeeze situation on Tuesday and went on to gain 11.6% by week's end.
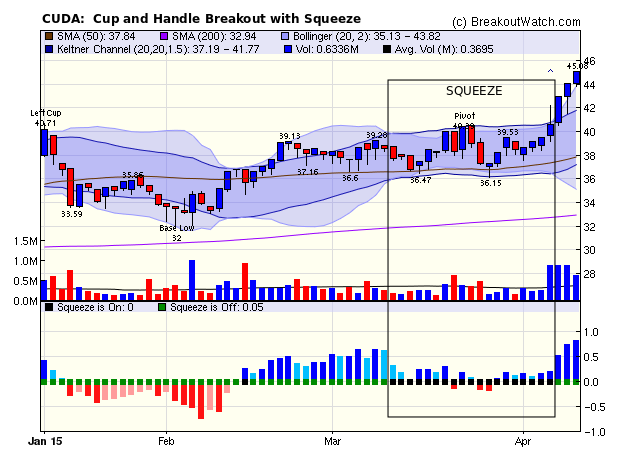
Volatiliy Squeeze breakouts from a cup and handle pattern are relatively rare. Since we introduced the indicator in November 2013, there have been only 51 out of a total of 798 cup and handle breakouts. An analysis of those 51 breakouts compared to those without a squeeze shows that a squeeze breakout is like a spring uncoiling. The breakout day "pop" is on average twice as high as a normal cup and handle breakout (6% compared to 3.1%). The momentum isn't maintained, however, and when we look at the average high within the next 7 and 30 days we see that the squeeze breakouts under-perform the non-squeeze breakouts.
| Breakout Pop |
7
Day High |
30 day High |
|
| Breakouts with Squeeze |
5.98 % | 5.43 % | 9.66 % |
| Breakouts without
Squeeze |
3.11 % | 6.57 % | 11.35 % |
Conclusion
For the day-trader, volatility squeeze breakouts from a cup and handle pattern can give a substantial profit on breakout day.
| Index | Value | Change Week | Change YTD | Trend | ||||||||||||||||||||||||||||||||||||
|---|---|---|---|---|---|---|---|---|---|---|---|---|---|---|---|---|---|---|---|---|---|---|---|---|---|---|---|---|---|---|---|---|---|---|---|---|---|---|---|---|
| Dow | 18057.7 | 1.66% | 1.32% | Up | ||||||||||||||||||||||||||||||||||||
| NASDAQ | 4995.98 | 2.23% | 5.49% | Up | ||||||||||||||||||||||||||||||||||||
| S&P 500 | 2102.06 | 1.70% | 2.1% | Up | ||||||||||||||||||||||||||||||||||||
1The Market Signal is derived
from our proprietary market model. The market model is
described on the site.
2The site also shows industry rankings based on fundamentals, combined technical and fundamentals, and on price alone. The site also shows daily industry movements. |
||||||||||||||||||||||||||||||||||||||||
|
Category
|
Symbol
|
Company Name
|
Expected Gain1
|
|---|---|---|---|
| Best Overall | MWW | Monster Worldwide, Inc. | 101 |
| Top Technical | MWW | Monster Worldwide, Inc. | 101 |
| Top Fundamental | GTN | Gray Television, Inc. | 67 |
| Top Tech. & Fund. | GTN | Gray Television, Inc. | 67 |
|
Category
|
Symbol
|
Company Name
|
Expected Gain1
|
|---|---|---|---|
| Best Overall | PZE | Petrobras Argentina S.A. | 95 |
| Top Technical | PZE | Petrobras Argentina S.A. | 95 |
| Top Fundamental | PZE | Petrobras Argentina S.A. | 95 |
| Top Tech. & Fund. | PZE | Petrobras Argentina S.A. | 95 |
If you received this newsletter from a friend and you would like to receive it regularly please go to the BreakoutWatch.com site and enter as a Guest. You will then be able to register to receive the newsletter.
Copyright © 2015 NBIcharts, LLC dba BreakoutWatch.com. All rights
reserved.
" BreakoutWatch," the BreakoutWatch.com "eye" logo, and the slogan
"tomorrow's breakouts today" are service marks of NBIcharts LLC.
All other marks are the property of their respective owners, and
are used for descriptive purposes only.
BreakoutWatch is not affiliated with Investor's Business Daily or
with Mr. William O'Neil. Our site, research and analysis is
supported entirely by subscription and is free from advertising.