| Market Summary | Weekly Breakout Report | Top Breakout Choices | Top 2nd Chances | New Features | Tip of the Week |
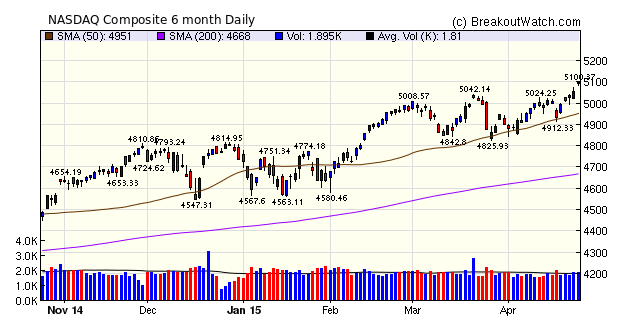
I follow the NASDAQ Composite index more closely than the other major indexes because, as I have shown here, it is from that exchange that the most profitable breakouts occur. This week, the NASDAQ closed at a 15 year high. Barry Ritholz explains here why it took the NASDAQ so long to close at a new high compared to just 6 years for the DJI and S&P 500 after the 2007 crash. The WSJ has an interactive display of the NASDAQ's wild ride since 1994 here.
Friday's surge came following strong results from Google, Amazon and Microsoft. Apple reports after the close on Monday.
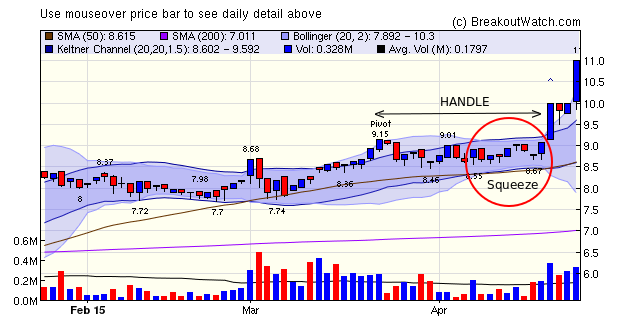
Last week I drew attention to the quick profits that can be made when a breakout occurs from a cup and handle pattern with a volatility squeeze in the handle. We have another example this week with CIGA which gained 20% following breakout on Tuesday.
| Breakouts for Week Beginning 04/20/15 | |||||||||
| Brkout Date | Symbol | Base | Squeeze | BrkoutOut Price | Brkout Day Close | RS Rank* | Last Close | Current % off BOP | Gain at Intraday High |
|---|---|---|---|---|---|---|---|---|---|
| 04/21/15 | CISG | CwH | Y | 9.15 | 9.99 | 91 | 11 | 20.22 | 20.22 |
| 04/22/15 | CAMP | HSB | N | 18.87 | 20.87 | 23 | 20.34 | 7.79 | 15.26 |
| 04/21/15 | TTS | CwH | N | 13.02 | 14.85 | 90 | 14.01 | 7.60 | 14.06 |
| 04/23/15 | PMC | SQZ | Y | 28.90 | 30.79 | 74 | 30.5 | 5.54 | 6.54 |
| 04/24/15 | MMSI | DB | N | 19.33 | 20.58 | 92 | 20.58 | 6.47 | 6.47 |
| 04/20/15 | HCKT | CwH | N | 9.36 | 9.81 | 92 | 9.74 | 4.06 | 6.41 |
| 04/23/15 | EXPO | CwH | N | 89.98 | 95.29 | 80 | 95.36 | 5.98 | 5.98 |
| 04/23/15 | RTEC | DB | N | 11.76 | 12.45 | 80 | 12.38 | 5.27 | 5.87 |
| 04/20/15 | RDN | CwH | N | 17.44 | 17.94 | 80 | 18.37 | 5.33 | 5.79 |
| 04/23/15 | IDXX | DB | N | 156.11 | 159.40 | 76 | 164.05 | 5.09 | 5.09 |
| 04/20/15 | OXM | CwH | N | 77.33 | 77.93 | 86 | 79.94 | 3.38 | 3.58 |
| 04/24/15 | DSW | SQZ | Y | 37.87 | 39.14 | 79 | 39.14 | 3.35 | 3.35 |
| 04/23/15 | CVTI | SQZ | Y | 34.45 | 35.59 | 98 | 33.15 | -3.77 | 3.31 |
| 04/23/15 | AMAG | HTF | N | 58.50 | 60.35 | 98 | 60.01 | 2.58 | 3.16 |
| 04/21/15 | ATHM | CwH | N | 51.89 | 52.01 | 92 | 53.31 | 2.74 | 2.74 |
| 04/23/15 | OSTK | CwH | N | 25.16 | 25.18 | 90 | 25.79 | 2.50 | 2.5 |
| 04/24/15 | HBM | SQZ | Y | 8.99 | 9.21 | 71 | 9.21 | 2.45 | 2.45 |
| 04/21/15 | CUDA | CwH | N | 45.08 | 45.79 | 93 | 46.12 | 2.31 | 2.31 |
| 04/23/15 | AFOP | CwH | N | 19.35 | 19.76 | 88 | 19.33 | -0.10 | 2.12 |
| 04/24/15 | TSM | SQZ | Y | 24.40 | 24.91 | 72 | 24.91 | 2.09 | 2.09 |
| 04/21/15 | XRM | CwH | N | 18.35 | 18.39 | 88 | 18.62 | 1.47 | 2.07 |
| 04/21/15 | DBJP | CwH | N | 42.73 | 43.19 | 80 | 43.34 | 1.43 | 1.99 |
| 04/24/15 | JD | HTF | N | 34.11 | 34.72 | 91 | 34.72 | 1.79 | 1.79 |
| 04/22/15 | ABT | SQZ | Y | 47.62 | 48.35 | 73 | 48.32 | 1.47 | 1.76 |
| 04/23/15 | KCG | SQZ | Y | 12.87 | 13 | 77 | 13.09 | 1.71 | 1.71 |
| 04/22/15 | AVOL | DB | N | 21.89 | 22.02 | 78 | 22.26 | 1.69 | 1.69 |
| 04/23/15 | IVC | CwH | N | 20.36 | 20.54 | 89 | 20.68 | 1.57 | 1.57 |
| 04/24/15 | CYOU | CwH | N | 28.87 | 29.32 | 85 | 29.32 | 1.56 | 1.56 |
| 04/23/15 | TAN | CwH | N | 49.19 | 49.95 | 91 | 48.51 | -1.38 | 1.55 |
| 04/22/15 | MA | DB | N | 89.82 | 91.20 | 75 | 90.72 | 1.00 | 1.54 |
| 04/22/15 | SYK | DB | N | 96.01 | 96.45 | 74 | 96.9 | 0.93 | 1.22 |
| 04/23/15 | TTMI | CwH | N | 9.21 | 9.31 | 89 | 9.22 | 0.11 | 1.09 |
| 04/24/15 | FNF | CwH | Y | 37.93 | 38.25 | 82 | 38.25 | 0.84 | 0.84 |
| 04/21/15 | ZNH | HTF | N | 52.58 | 53.00 | 99 | 50.72 | -3.54 | 0.8 |
| 04/22/15 | AN | CwH | N | 65.46 | 65.83 | 81 | 64.8 | -1.01 | 0.57 |
| 04/20/15 | AEL | CwH | N | 29.54 | 29.60 | 81 | 28.97 | -1.93 | 0.44 |
| 04/23/15 | JNS | CwH | N | 18.45 | 18.51 | 86 | 18.51 | 0.33 | 0.33 |
| 04/23/15 | COLB | SQZ | Y | 30.08 | 30.15 | 76 | 29.84 | -0.80 | 0.23 |
| 04/21/15 | ELY | SQZ | Y | 10.04 | 10.06 | 86 | 9.89 | -1.49 | 0.2 |
| 04/24/15 | RLH | SQZ | Y | 6.99 | 7 | 78 | 7 | 0.14 | 0.14 |
| 04/20/15 | MTRN | CwH | N | 40.48 | 40.50 | 83 | 40.26 | -0.54 | 0.05 |
| 04/22/15 | STM | CwH | N | 9.94 | 9.94 | 82 | 9.44 | -5.03 | -0 |
| Weekly Average (42 breakouts) | 2.17 | 3.39 | |||||||
| *RS Rank on day before breakout. | |||||||||
No new Features this week.
Revised Recommendations for Trading Cup and Handle Patterns
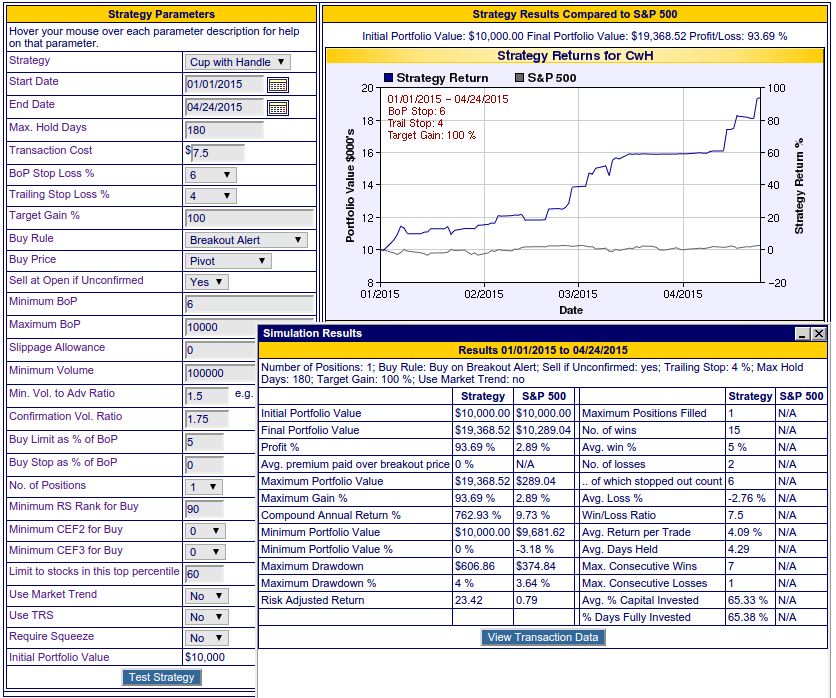
I have run our cup with handle backtest for 2015 and now have the following minor modification to my previous recommendations. The minor modification are in bold and highlighted below.
For the optimal return (best profit at least risk) from breakouts from our cup with handle watchlist, I now recommend the following trading strategy:
- Each day, create a personal watchlist of stocks that satisfy
- RS Rank must be at least 90
- Industry Rank must be in the top 60 percentile (i.e. have a rank less than 135 in our industry ranking scheme)
- Average daily volume >= 100,000.
- Buy on alert
- Sell at next open if volume at end of breakout day is less than 1.75 times average 50 day volume
- Sell if stock drops 6% or more from the breakout price.
- After purchase set a 4% trailing stop by monitoring daily high's and setting a stop loss at 4% of the maximum high after breakout. Adjust daily if necessary.
- Sell if trailing stop met intraday. (use a sell stop order).
Using our 1 position strategy, these recommendations would have returned over 90% since January 1 this year. (See image below for our backtest results. Click for original size)
| Index | Value | Change Week | Change YTD | Trend | ||||||||||||||||||||||||||||||||||||
|---|---|---|---|---|---|---|---|---|---|---|---|---|---|---|---|---|---|---|---|---|---|---|---|---|---|---|---|---|---|---|---|---|---|---|---|---|---|---|---|---|
| Dow | -100% | -100% | Up | |||||||||||||||||||||||||||||||||||||
| NASDAQ | 17826.3 | 261.46% | 276.4% | Up | ||||||||||||||||||||||||||||||||||||
| S&P 500 | 4931.81 | 136.97% | 139.54% | Up | ||||||||||||||||||||||||||||||||||||
1The Market Signal is derived
from our proprietary market model. The market model is
described on the site.
2The site also shows industry rankings based on fundamentals, combined technical and fundamentals, and on price alone. The site also shows daily industry movements. |
||||||||||||||||||||||||||||||||||||||||
|
Category
|
Symbol
|
Company Name
|
Expected Gain1
|
|---|---|---|---|
| Best Overall | MWW | Monster Worldwide, Inc. | 107 |
| Top Technical | MWW | Monster Worldwide, Inc. | 107 |
| Top Fundamental | GTN | Gray Television, Inc. | 66 |
| Top Tech. & Fund. | GTN | Gray Television, Inc. | 66 |
|
Category
|
Symbol
|
Company Name
|
Expected Gain1
|
|---|---|---|---|
| Best Overall | HCKT | The Hackett Group, Inc. | 86 |
| Top Technical | ATHM | Autohome Inc. | 42 |
| Top Fundamental | ATHM | Autohome Inc. | 42 |
| Top Tech. & Fund. | ATHM | Autohome Inc. | 42 |
If you received this newsletter from a friend and you would like to receive it regularly please go to the BreakoutWatch.com site and enter as a Guest. You will then be able to register to receive the newsletter.
Copyright © 2015 NBIcharts, LLC dba BreakoutWatch.com. All rights
reserved.
" BreakoutWatch," the BreakoutWatch.com "eye" logo, and the slogan
"tomorrow's breakouts today" are service marks of NBIcharts LLC.
All other marks are the property of their respective owners, and
are used for descriptive purposes only.
BreakoutWatch is not affiliated with Investor's Business Daily or
with Mr. William O'Neil. Our site, research and analysis is
supported entirely by subscription and is free from advertising.